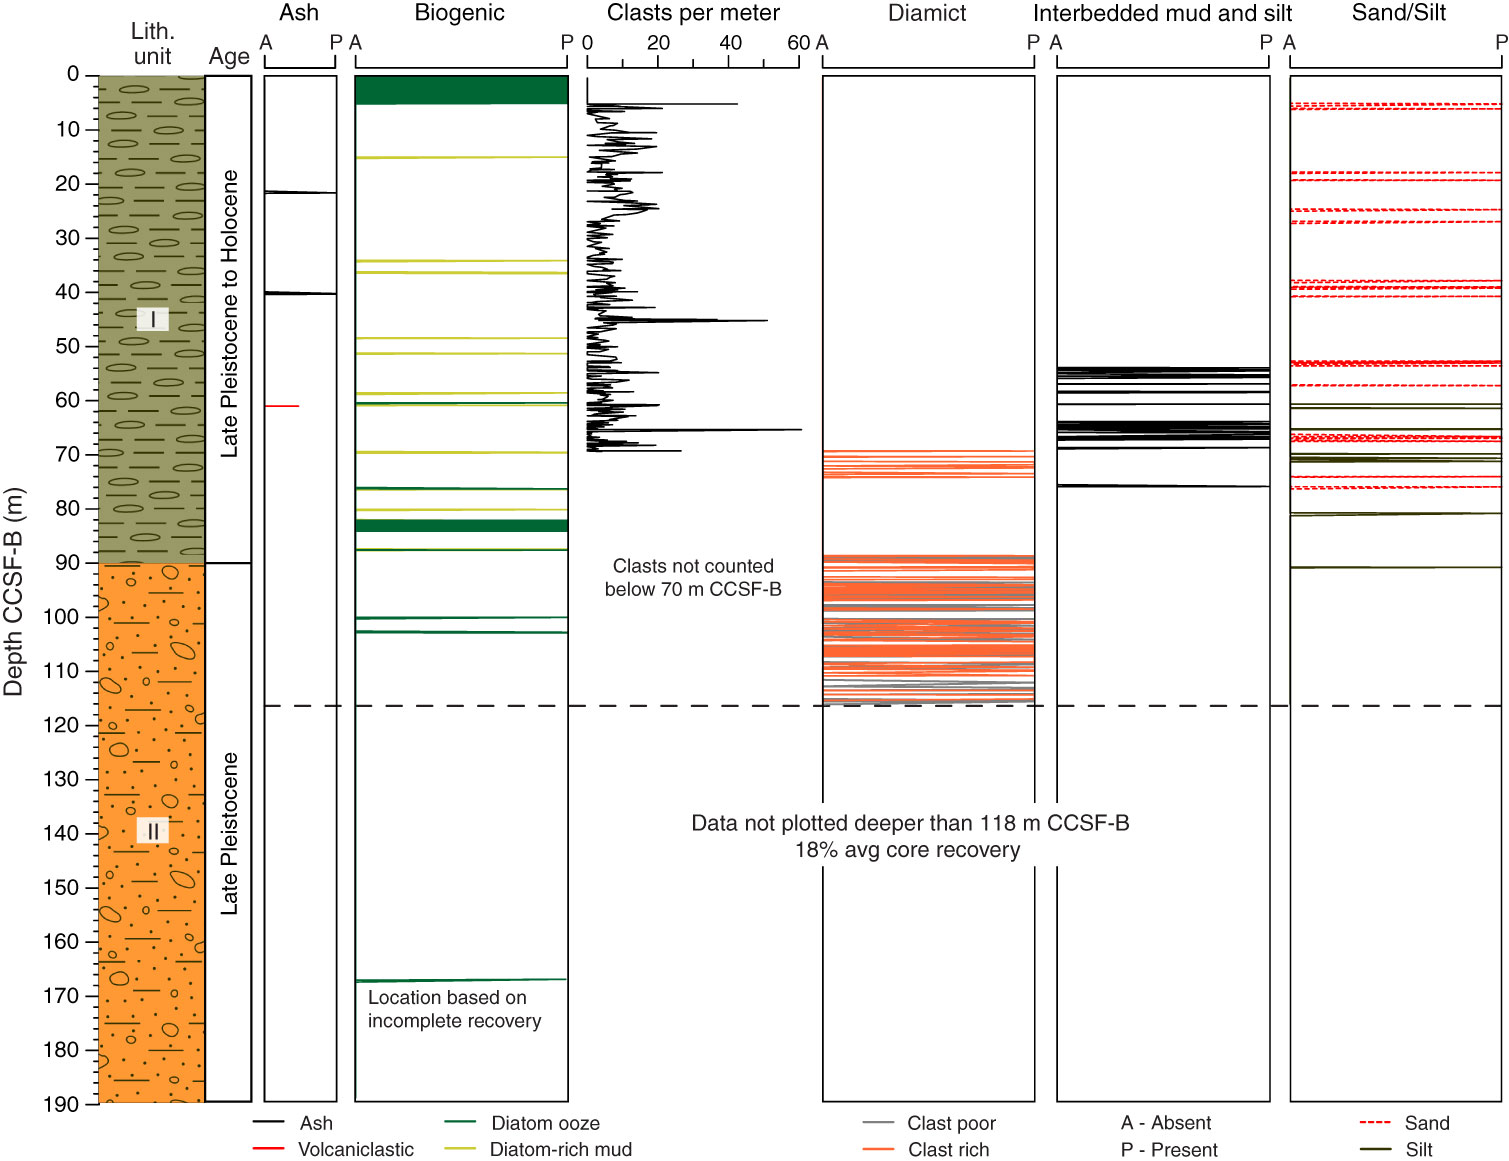
Figure F9. Schematic diagram of lithostratigraphic units and major lithologies, Site U1419. Clasts per meter column indicates number of lonestones per meter. With the exception of lonestone counts, downcore profiles represent the occurrence of a described lithologic feature. Data from Holes U1419A–U1419E were combined to produce these profiles. Because of low core recovery (average = 18%) deeper than 118 m CCSF-B, we do not show the distribution of lithostratigraphic features beneath this depth. Because of the large abundance of clasts deeper than 70 m CCSF-B, individual clasts (>2 mm) were not counted.
Previous | Close | Next | Top of page