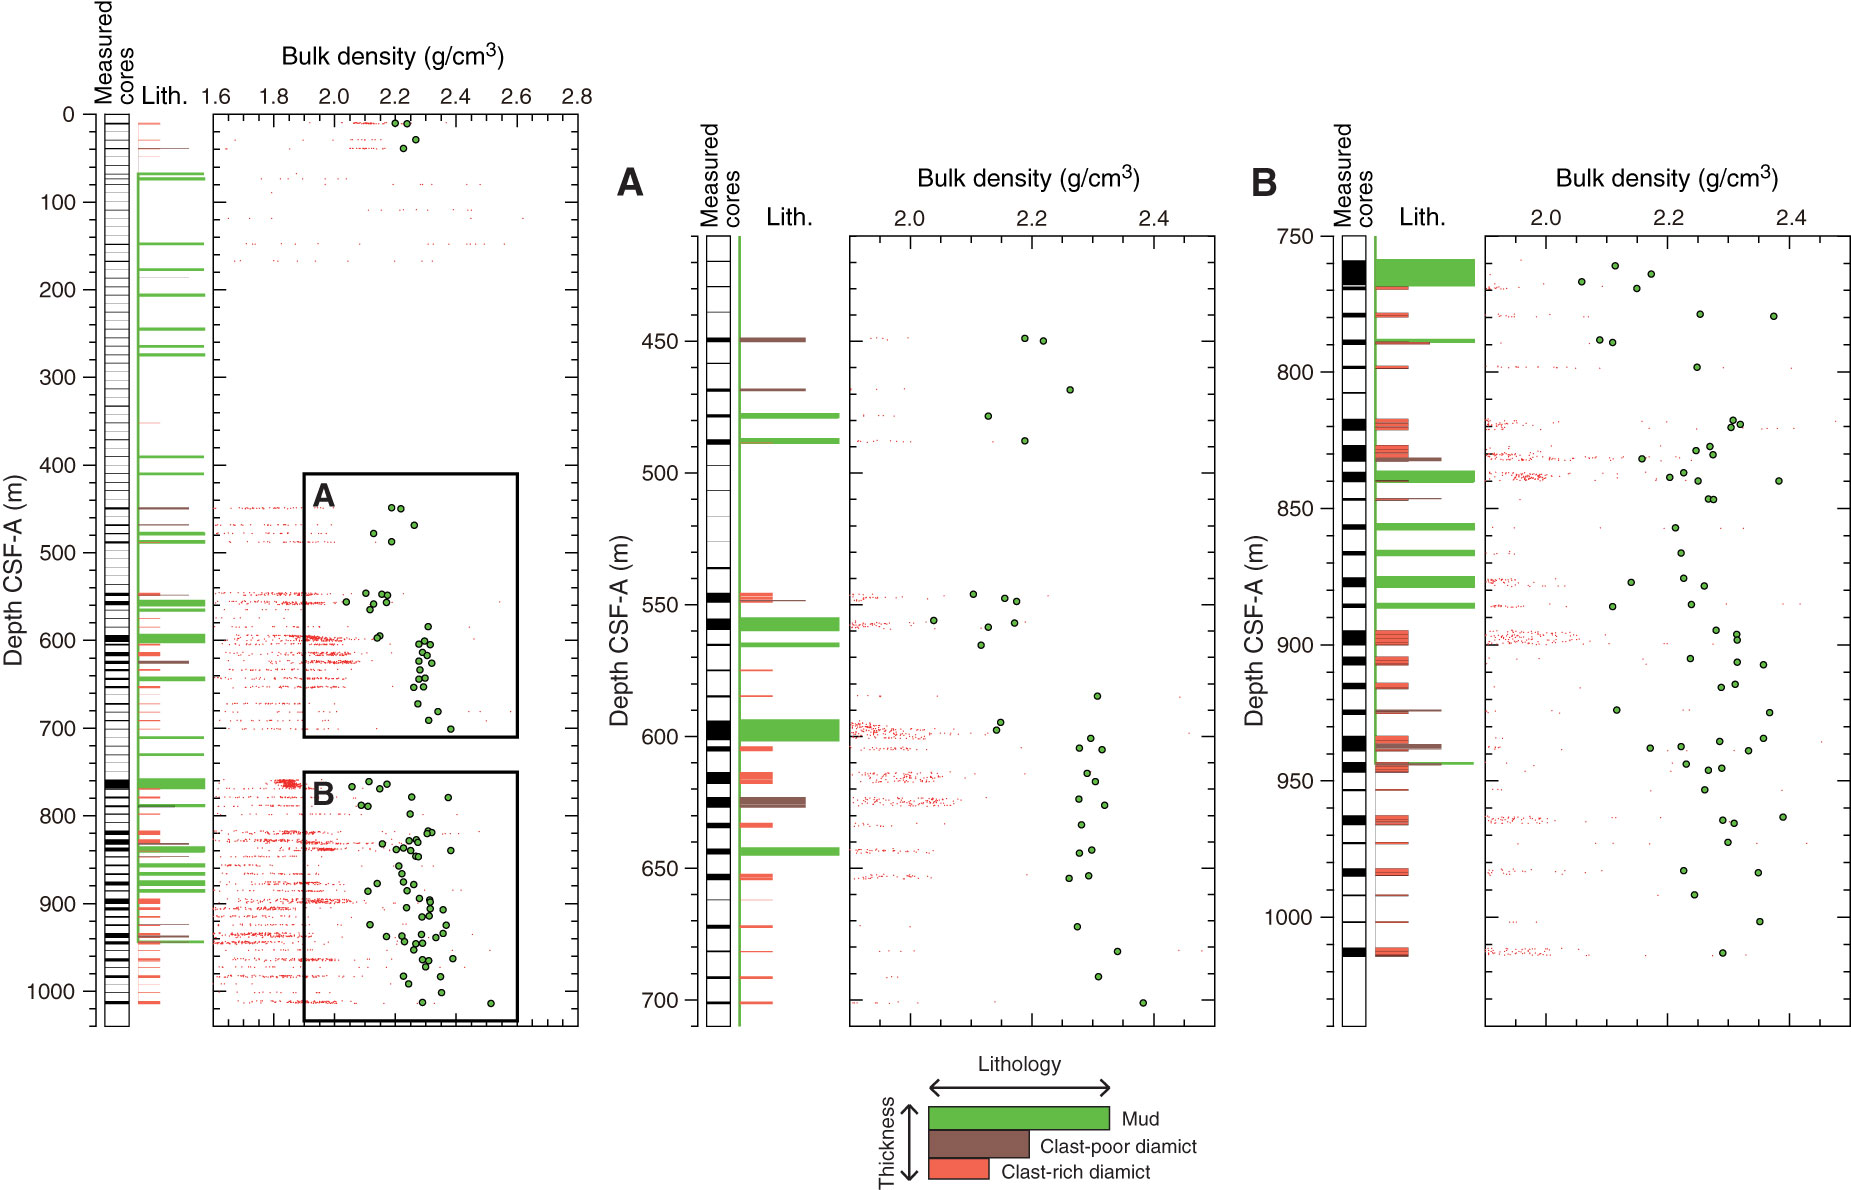
Figure F23. GRA bulk density data measured on the Whole-Round Multisensor Logger (dots) vs. discrete wet bulk density data (circles), Hole U1420A. Sample lithologies: red = clast-rich diamict, brown = clast-poor diamict, green = mud.

Previous | Close | Next | Top of page