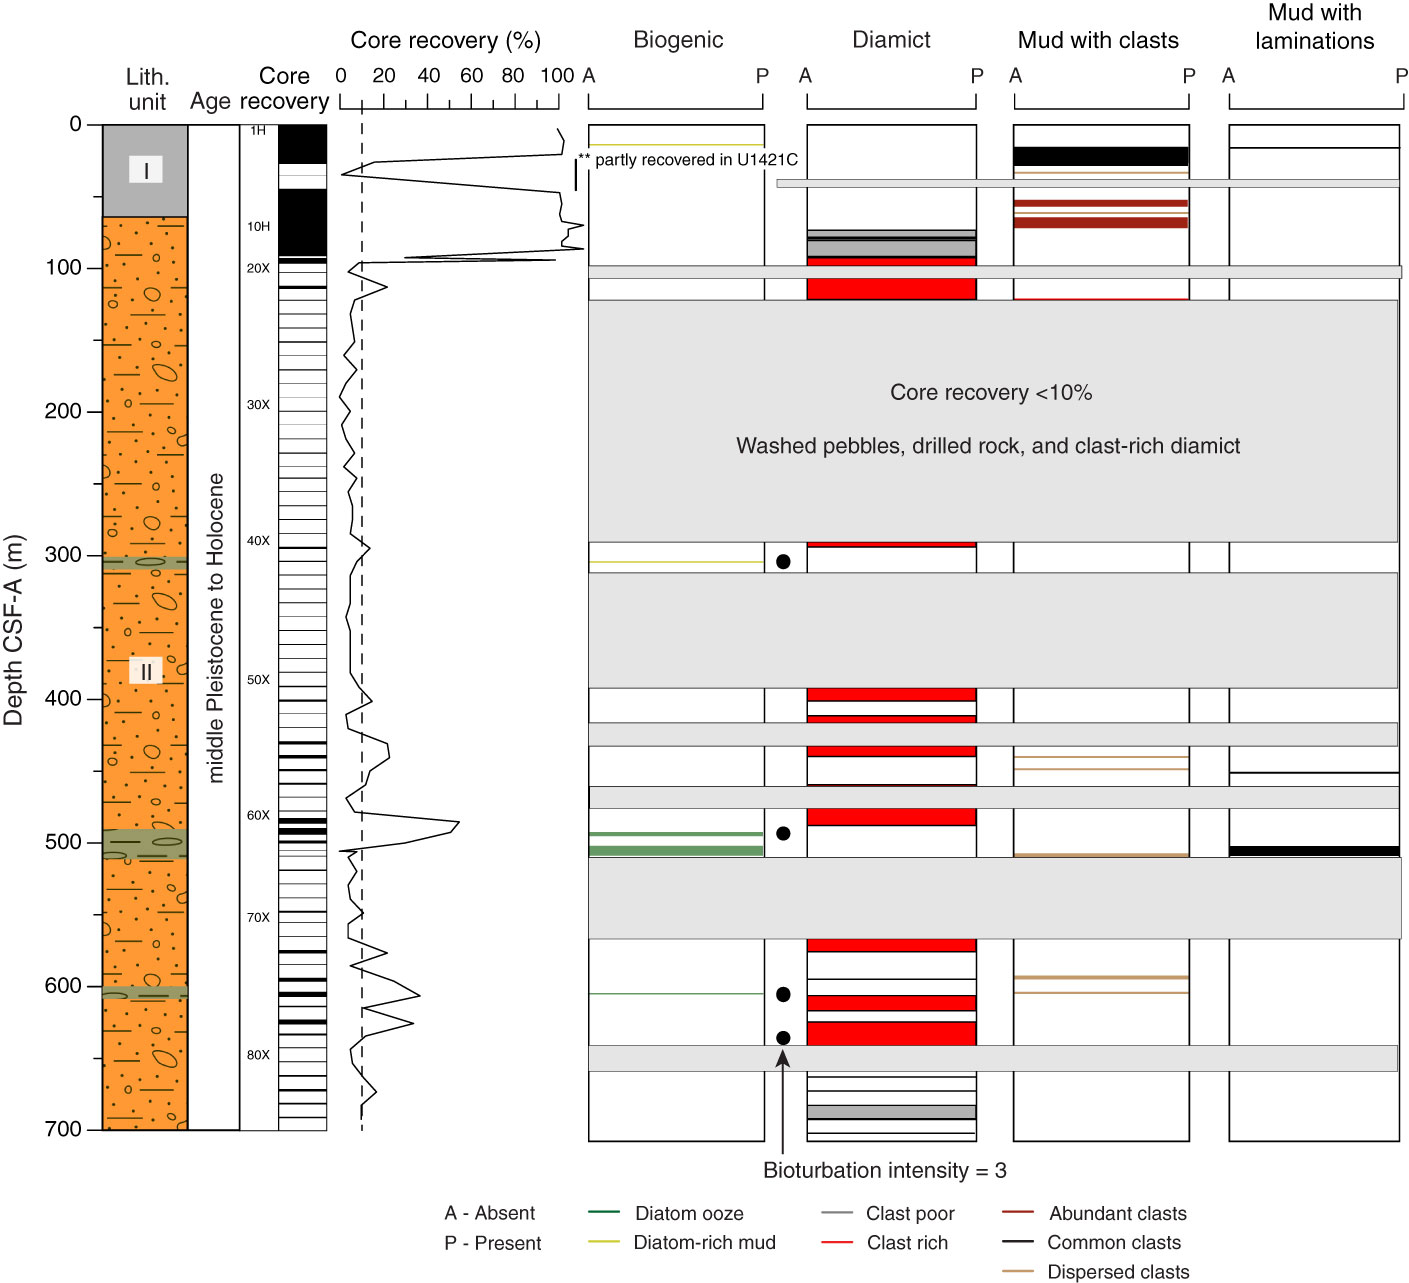
Figure F11. Schematic diagram of lithostratigraphic units and major lithologies, Site U1421. Circles = intervals of mud with high bioturbation. With the exception of core recovery, downcore profiles represent the occurrence of a described lithologic feature. Gray rectangles highlight depths where core recovery was <10% and largely consists of washed pebbles, drilled rock, and clast-rich diamict. The low-recovery interval between 25 and 36 m CSF-A was partly recovered in Hole U1421C (see “Stratigraphic correlation”) and largely consists of mud with abundant and common clasts.
Previous | Close | Next | Top of page