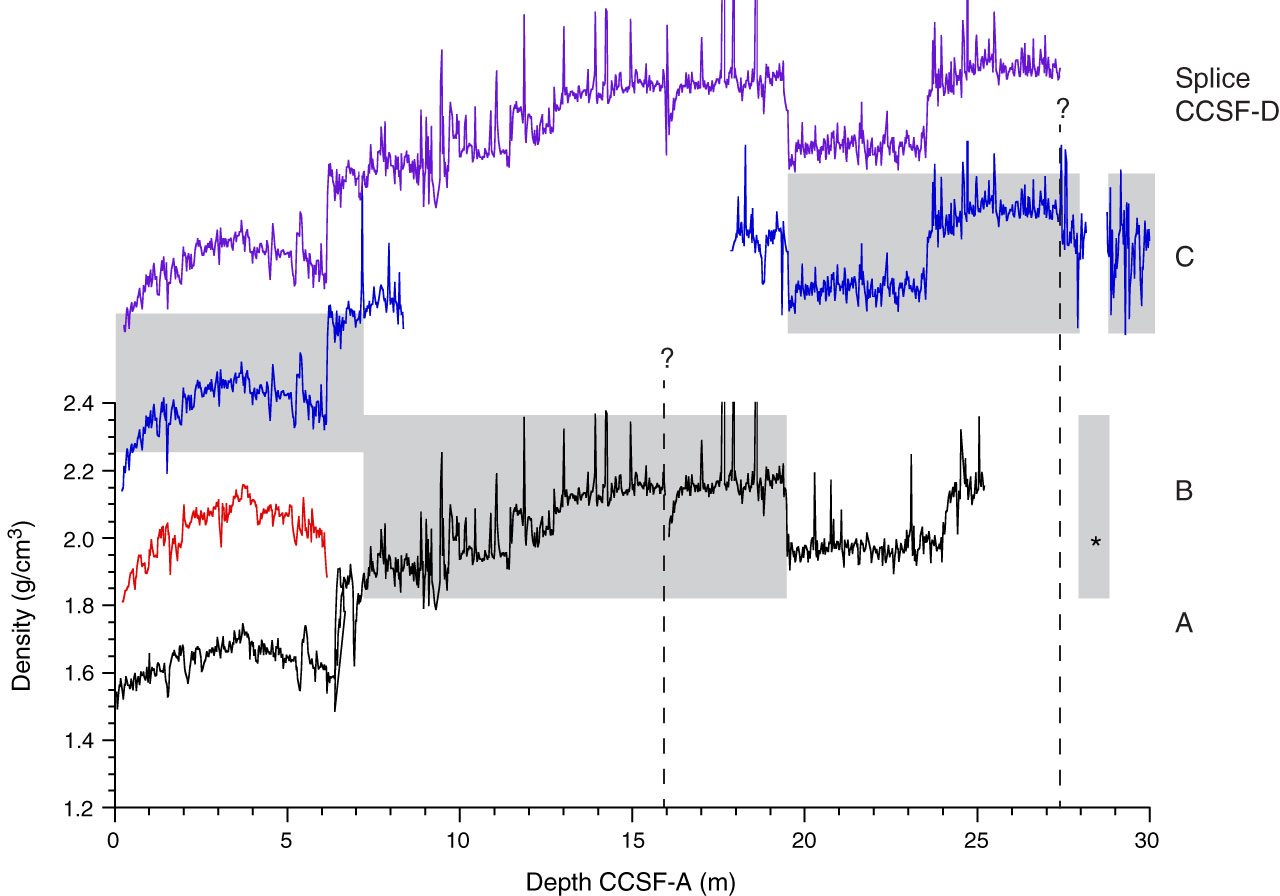
Figure F16. GRA bulk density data for the interval of the continuous splice in Holes U1421A–U1421C and the splice record, 0–30 m CCSF-A. Gray boxes = intervals used to construct the splice, dashed vertical lines with question marks = append points that should be treated with caution (see text for details). Asterisks = intervals in which magnetic susceptibility data could not be run on the WRMSL because of core-liner patches; in these cases, magnetic susceptibility is available from STMSL or SHMSL runs.
Previous | Close | Next | Top of page