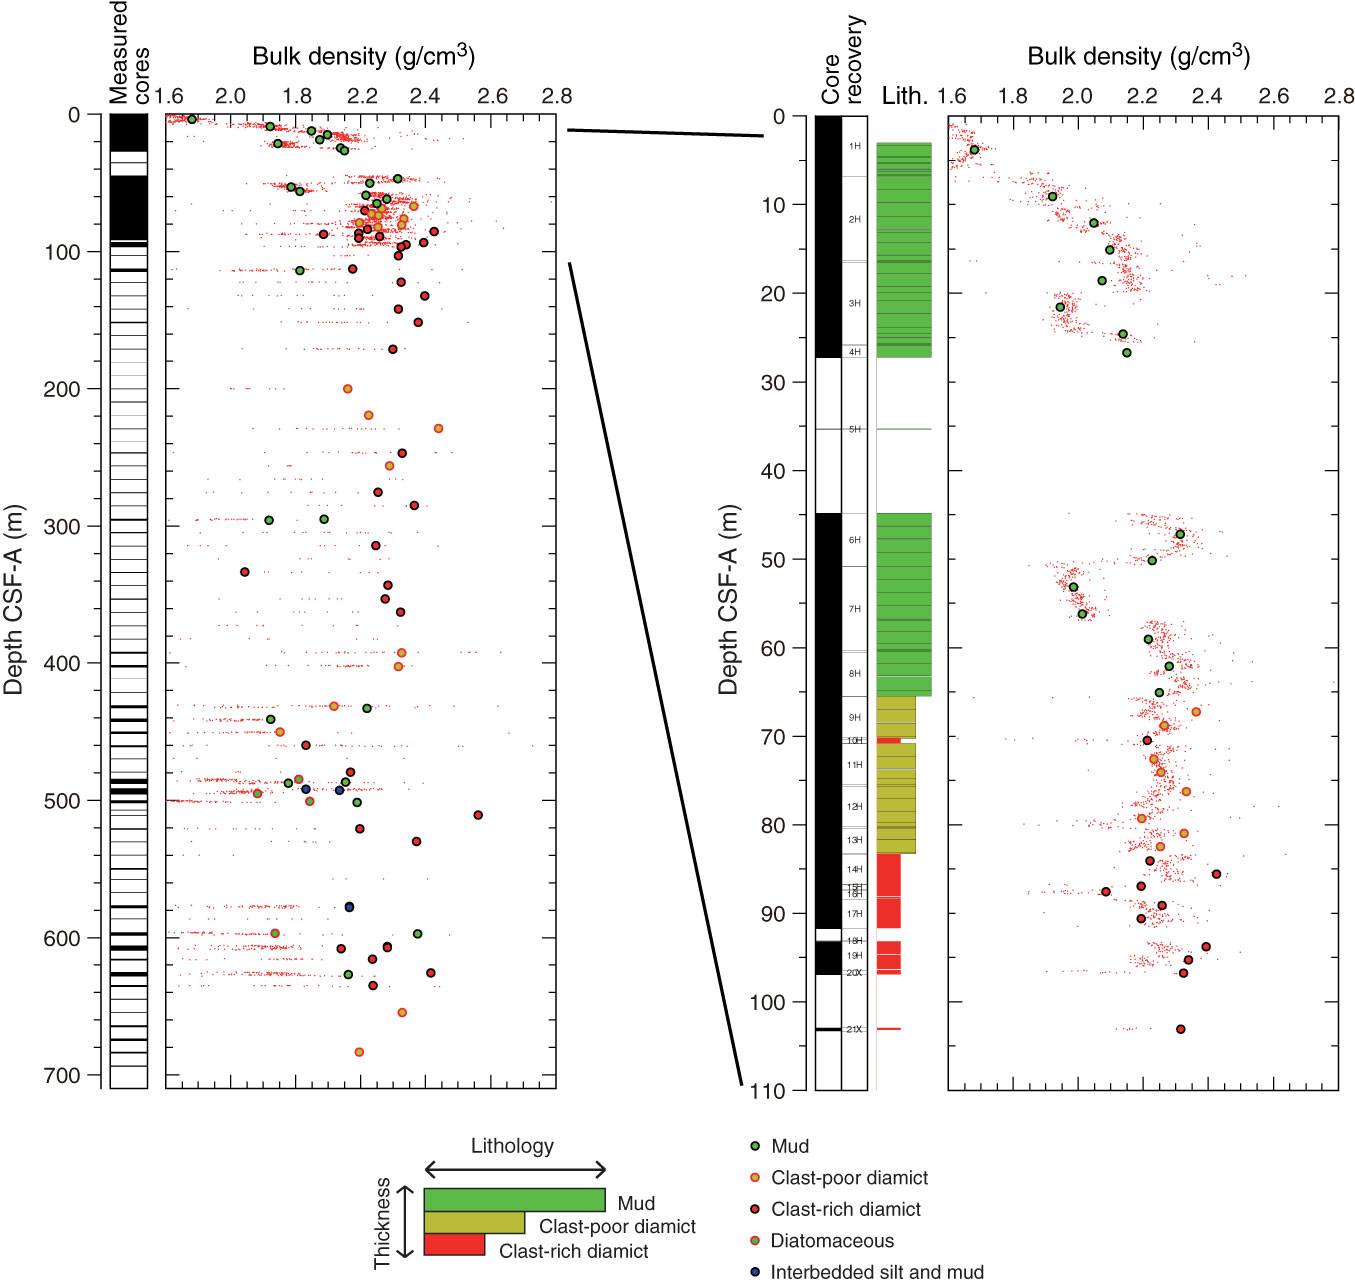
Figure F8. Gamma ray attenuation (GRA) bulk density data measured on the WRMSL (dots) vs. discrete wet bulk density data (circles), Hole U1421A. Sample lithologies: red/black = clast-rich diamict, light-green/orange = clast-poor diamict, green/black = mud, green/red = diatomaceous, and blue/black = interbedded silt and mud.
Previous | Close | Next | Top of page