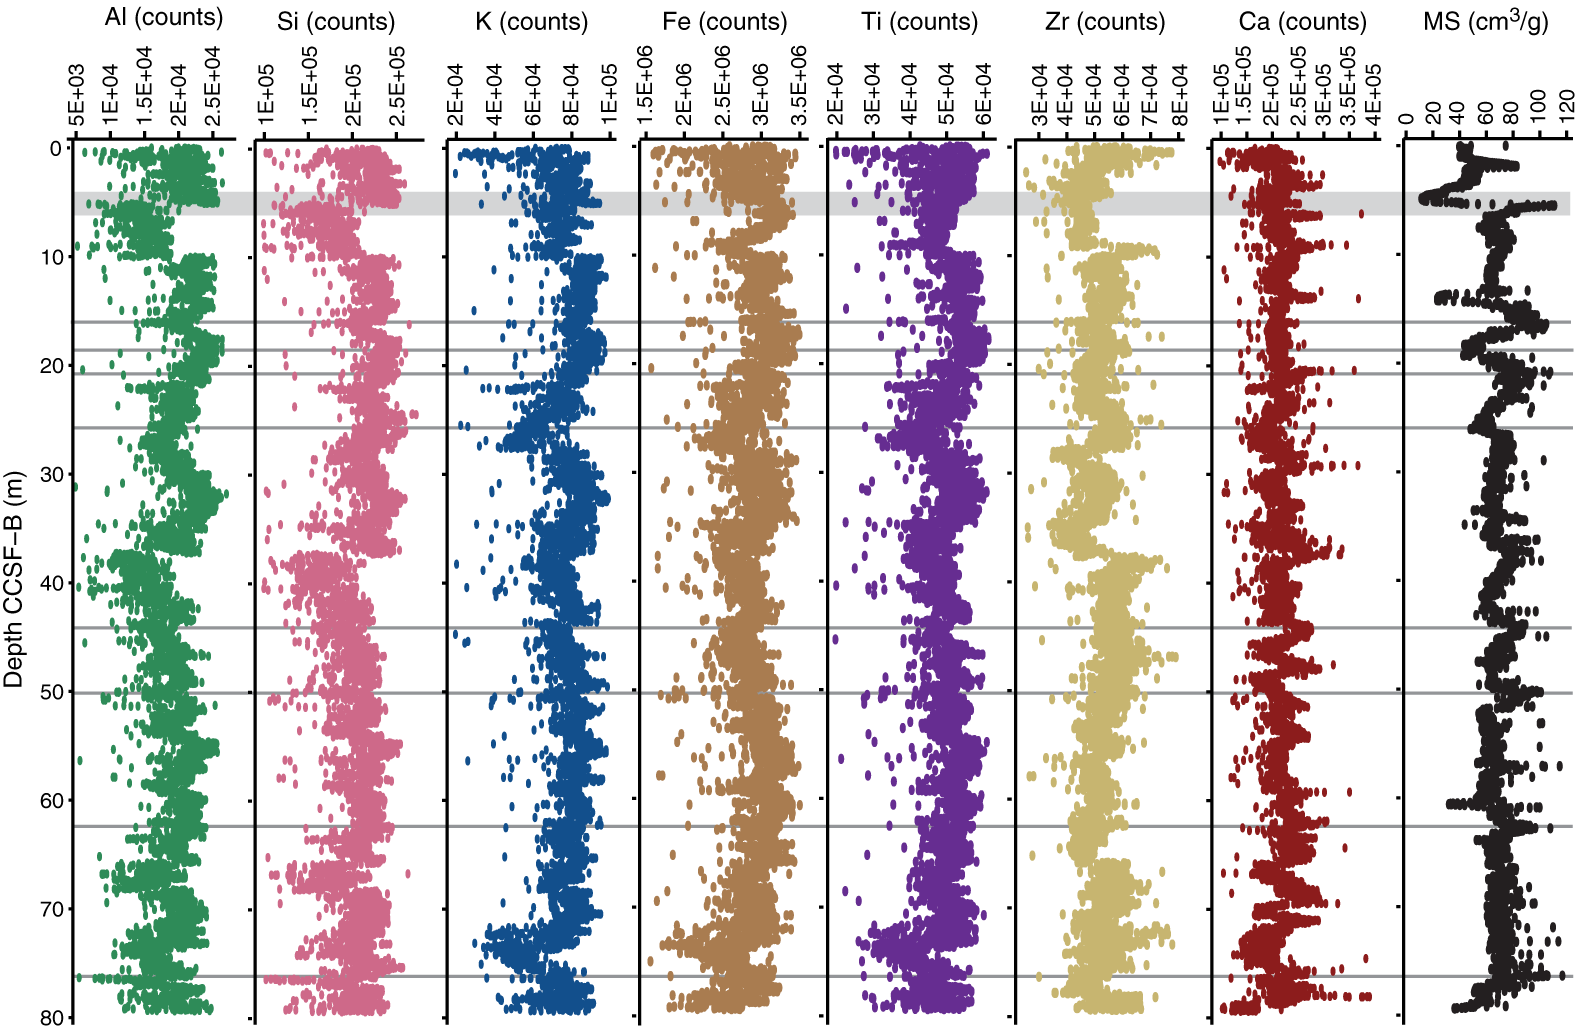
Figure F3. XRF scanner counts for Al, Ca, K, Fe, Si, Ti, and Zr with volume-corrected magnetic susceptibility (MS) (Walczak et al., 2015). Gray shaded band is assumed to represent glacimarine diamict to hypoxic laminated facies transition that is observed at ~14.8 ka in EW0408 85JC (Davies et al., 2011). Gray horizontal lines highlight points of major variations in MS as it relates to variability in detrital elements (i.e., Al, Fe, and Ti).
Previous | Close | Top of page