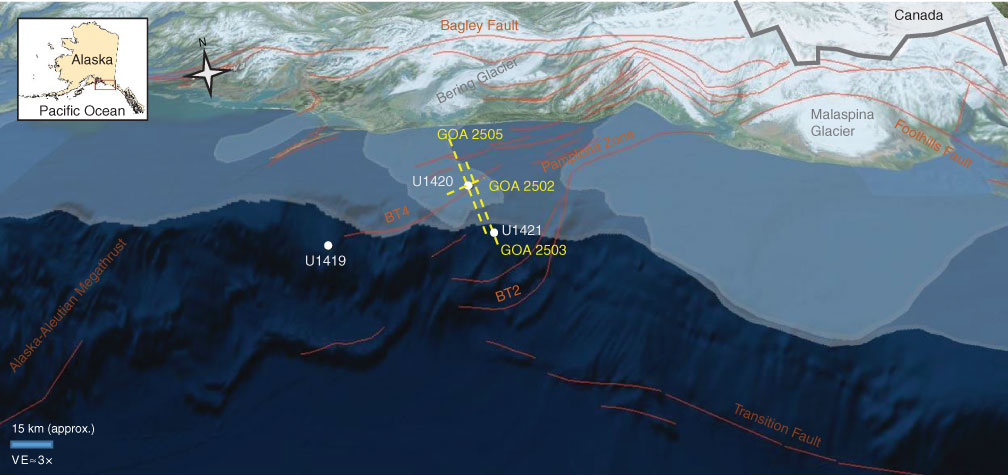
Figure F1. Site U1419–U1421 locations (white circles). Satellite imagery (Source: esri) is draped over topography and bathymetry (Source: NGA, USGS). Red lines = major quaternary faults (Koehler et al., 2012), BT = blind thrust faults (after Worthington et al., 2010). Medium blue = maximum glacial extent during the last ~3 My, light blue = Wisconsin Last Glacial Maximum extent (Manley and Kaufman, 2002). Dashed yellow lines = approximate locations of seismic Lines GOA 2502, GOA 2503, and GOA 2505 from seismic Survey EW0408 collected aboard the R/V Maurice Ewing in 2004.
Close | Next | Top of page