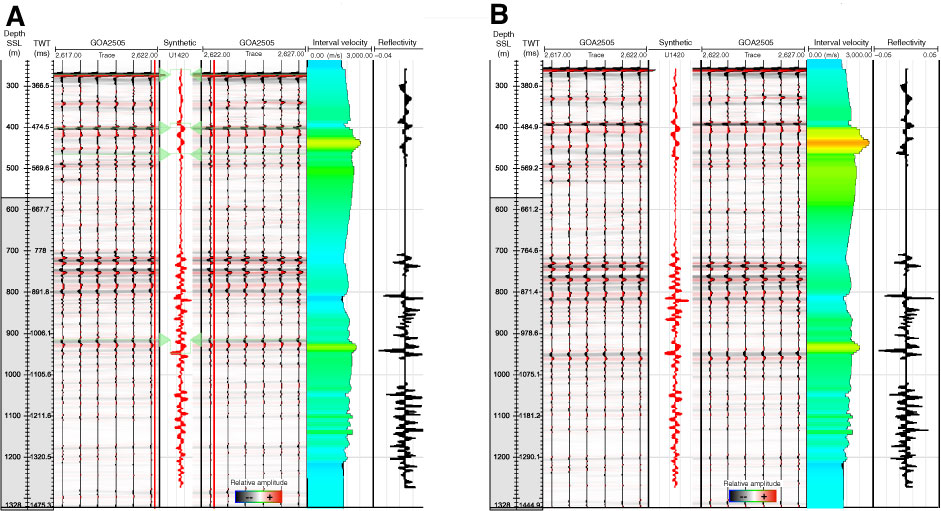
Figure F12. A. Traces from USGS 2004 EW0408 survey seismic Line GOA 2505 shown at shot locations 2617–2627 with initial TDR and visual matches (green) between the seismic and synthetic generated at Site U1420. The last two panels show the calculated interval velocity and reflectivity. Synthetic seismic was produced using the reflectivity series and the extracted wavelet shown in Figure F11C. TWT = two-way traveltime. B. Synthetic shown with seismic traces 2617–2627 and the TDR after applying the matches. The two right panels show the calculated interval velocity and reflectivity.
Previous | Close | Next | Top of page