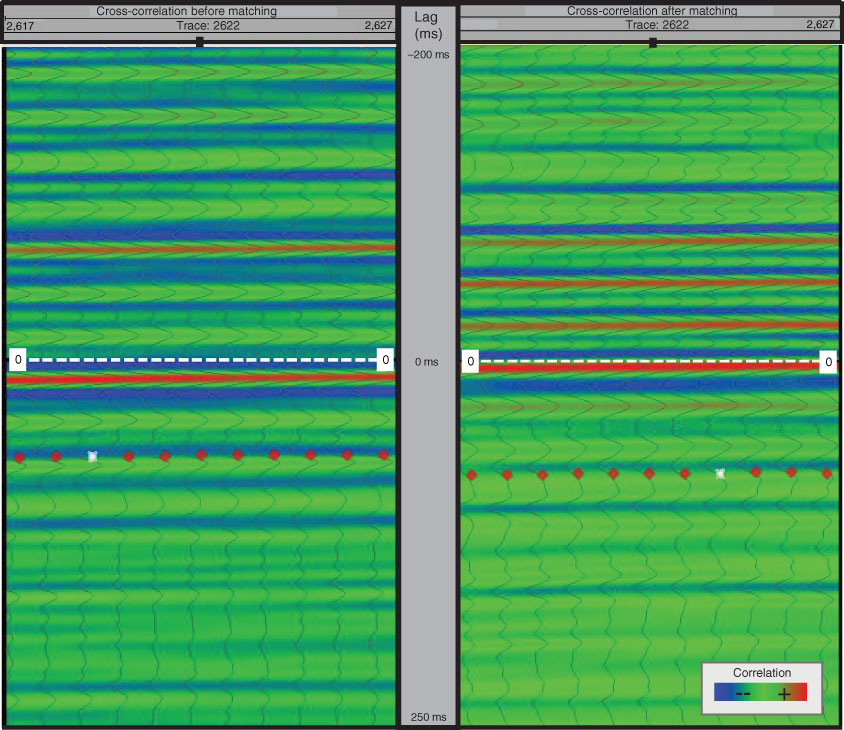
Figure F14. Cross-correlation before (left) and after (right) the tie, Site U1420. Before matching, the maximum cross-correlation within 5 traces of the site, nearest Trace 2622 on Line GOA 2505, was 0.367 with Trace 2619 with a lag of 13 ms in the 340–1410 ms window. At the site trace, the cross-correlation was calculated as –0.118 at 0 ms lag. After a bulk shift and matching, we calculate that the maximum cross-correlation occurred at Trace 2624 and 3 ms lag. At Trace 2622, the maximum cross-correlation was calculated to be 0.188 at 0 ms lag, whereas the maximum cross-correlation for this trace, 0.350, occurs with 3 ms lag. White asterisk = trace of maximum cross-correlation.
Previous | Close | Next | Top of page