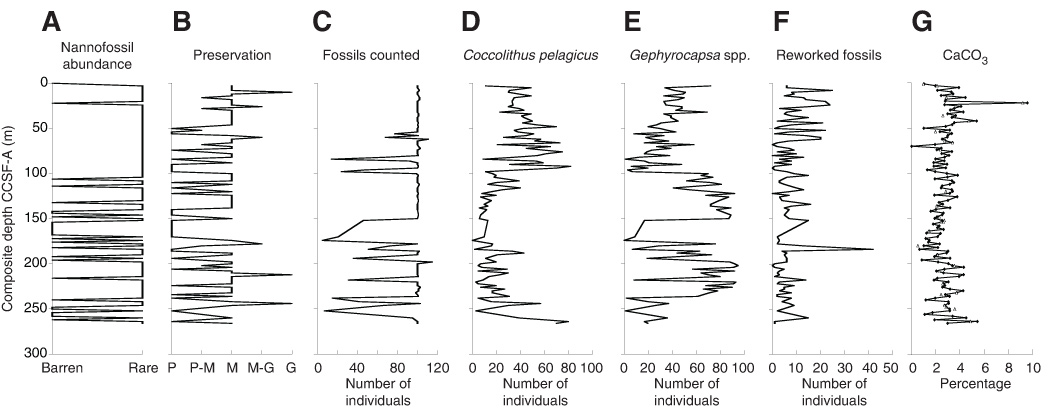
Figure F2. Nannofossil and carbonate weight percentage results plotted on the Site U1418 shipboard stratigraphic splice (m CCSF-A). A. Qualitative nannofossil abundance. B. Nannofossil preservation (P = poor, M = moderate, G = good). C. Number of nannofossil specimens counted in each sample. D–F. Number of Coccolithus pelagicus, Gephyrocapsa spp., and reworked fossils counted. G. Calcium carbonate weight percentage (open triangles = replicate measurements).
Previous | Close | Next | Top of page