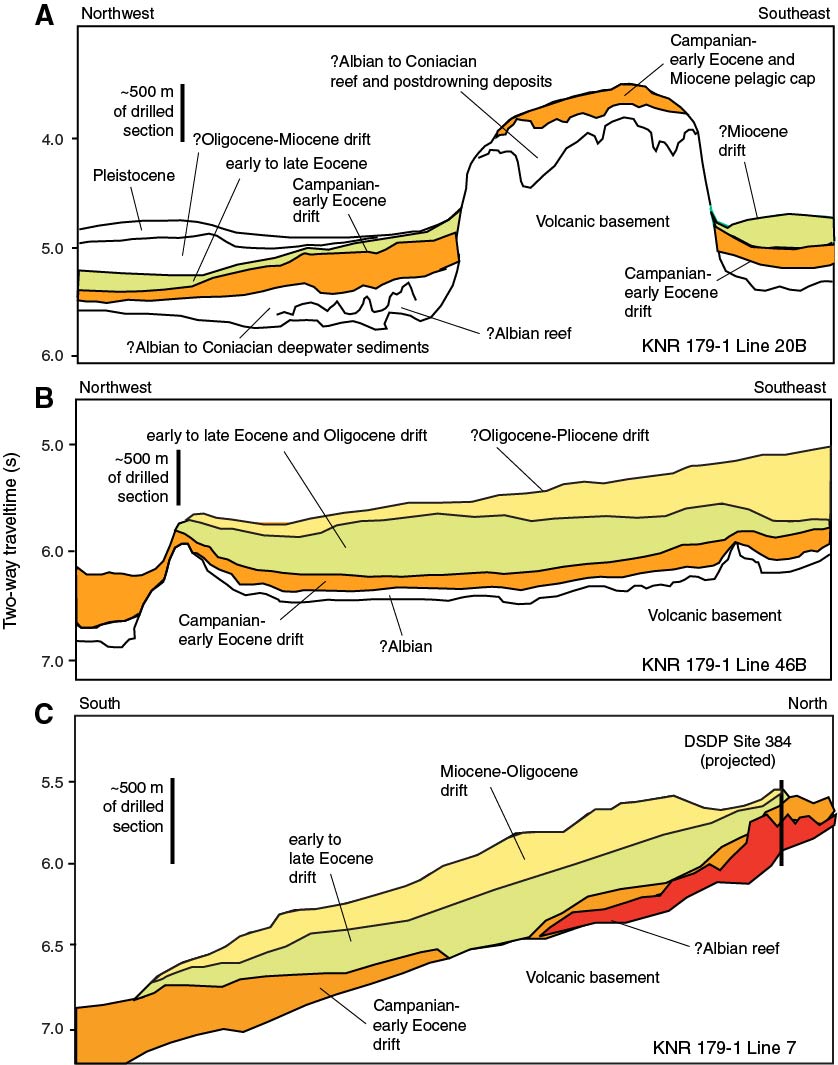
Figure F10. Interpreted seismic records from (A) Southeast Newfoundland Ridge seamount area, (B) Southeast Newfoundland Ridge eastern end, and (C) J-Anomaly Ridge. The approximate age range of the various seismic units are shown in different colors. Note the large variation in thickness and distribution of drift packages.
Previous | Close | Next | Top of page