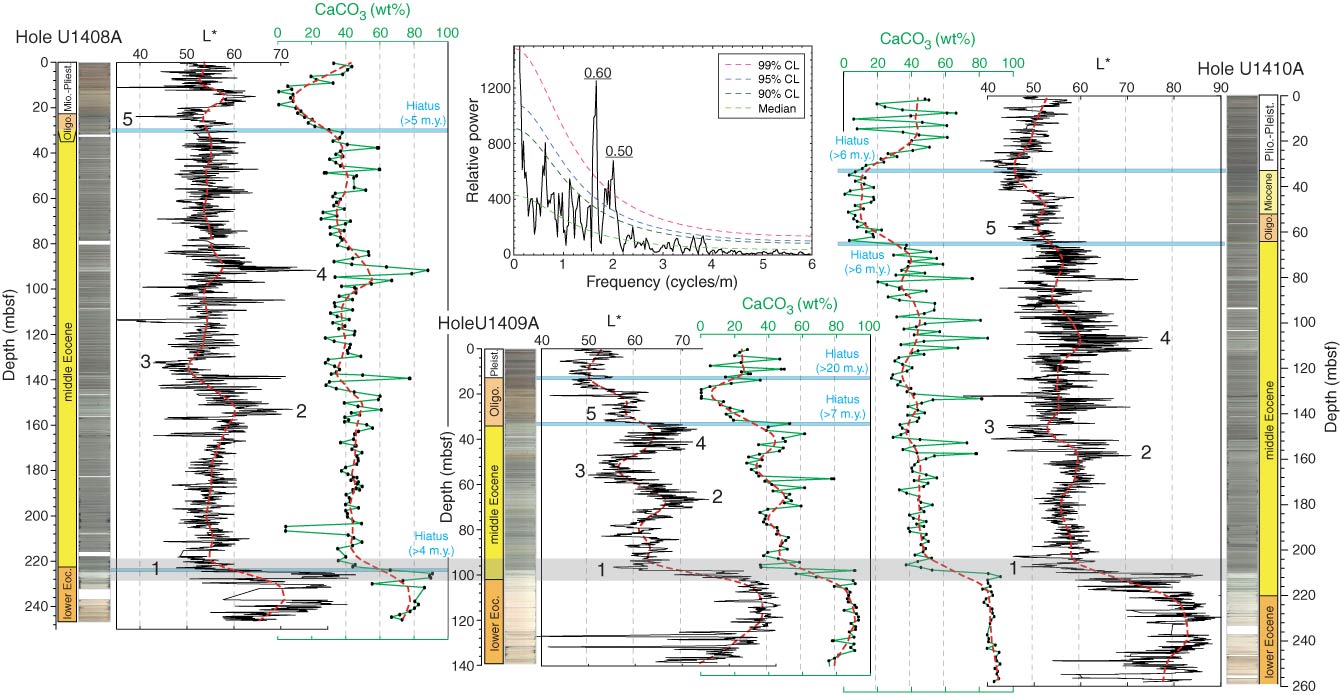
Figure F50. Plots of color reflectance (L*) and carbonate content variations, Sites U1408–U1410. The three holes are anchored at the early/middle Eocene boundary. High-resolution (5 cm) L* data are smoothed with a five-point moving average and then fitted to a 10% weighted average of the smoothed series (dashed lines). Low-resolution (mean sampling = 1.4 m) carbonate data are fitted to a 9% weighted average of the series (dashed lines). Note the correspondence between L* and carbonate at long-term variations within the lower–middle Eocene; these data types also correlate at the scale of 0.5 to 0.6 m wavelengths (top middle panel, see text for discussion). Numbers 1–5 are correlatable intervals between holes based on long-term variations of L* and carbonate data. Note that all scales are the same for the three holes. Power spectrum plot is for 33–71 mbsf in Hole U1409A. CL = confidence level.
Previous | Close | Next | Top of page