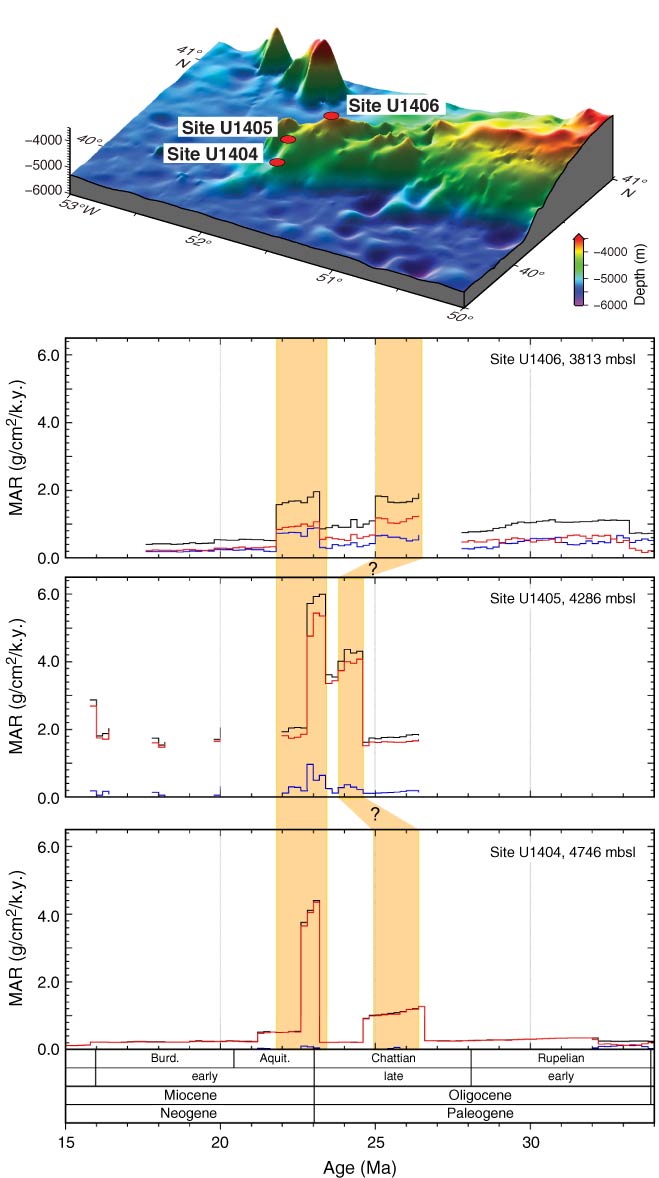
Figure F55. Mass accumulation rate (MAR) for Oligocene–Miocene sequences of J-Anomaly Ridge Sites U1404–U1406. Black lines = total MAR, blue lines = carbonate accumulation rates, red lines = noncarbonate accumulation rates. Orange shading indicates intervals of drift deposition on the ridge.
Previous | Close | Next | Top of page