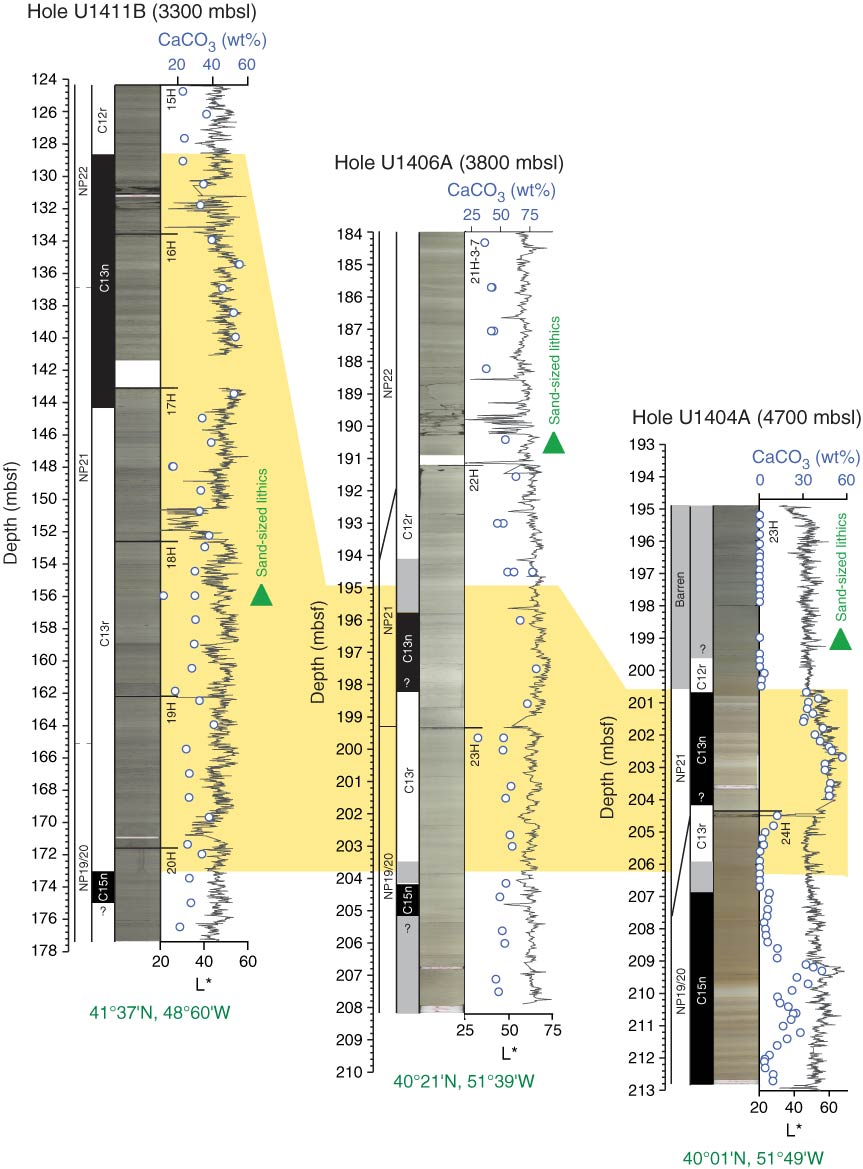
Figure F60. Lithologic expression of the Eocene–Oligocene transition, Sites U1404, U1406, and U1411. Calcium carbonate content and brightness (L*) derived from color reflectance measurements. Yellow area indicates the stratigraphic interval between chron boundaries C15n/C13r (34.999 Ma; Gradstein et al., 2012) and C13n/C12r (33.157 Ma; Gradstein et al., 2012) between sites; where not unequivocally defined (gray shading), midpoints were used.
Previous | Close | Next | Top of page