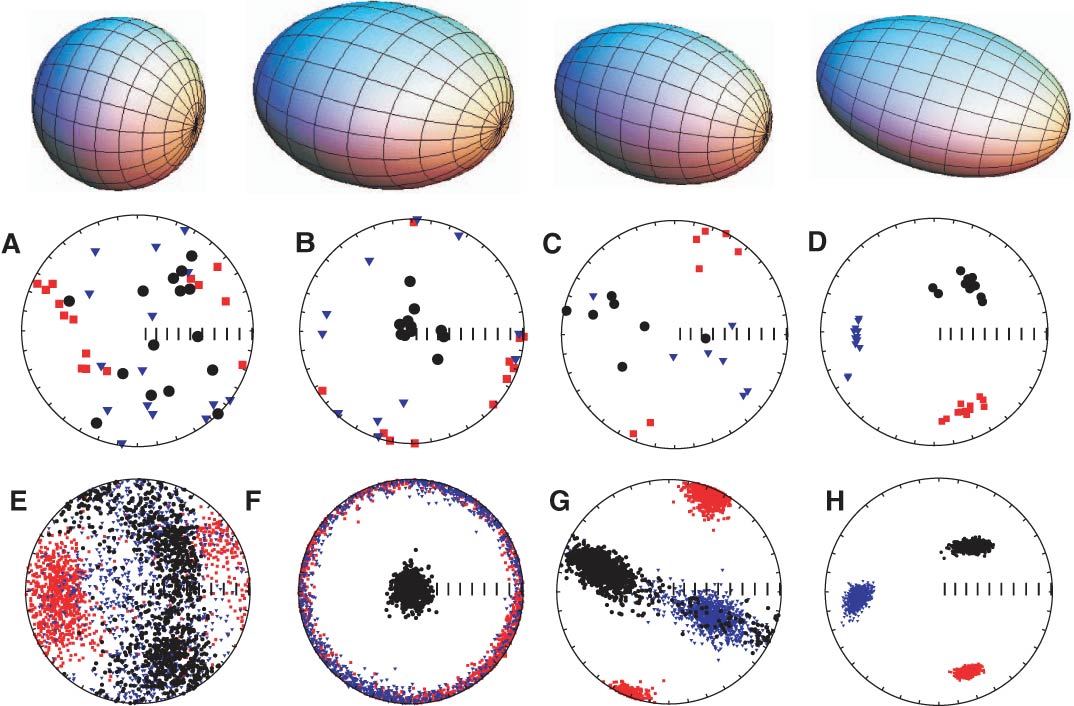
Figure F8. Interpretation of anisotropy of magnetic susceptibility data, Expedition 342. The top, colored balloons illustrate, from left to right, isotropic, oblate, prolate, and triaxial ellipsoids. A–D. Example data sets plotted as eigenvector directions from individual samples on equal-area projections. Squares = directions associated with the maximum eigenvalues, triangles = directions associated with intermediate eigenvalues, circles = directions associated with minimum eigenvalues. E–H. Bootstrapped eigenvectors from A–D, respectively. Adapted from Tauxe (2010).
Previous | Close | Next | Top of page