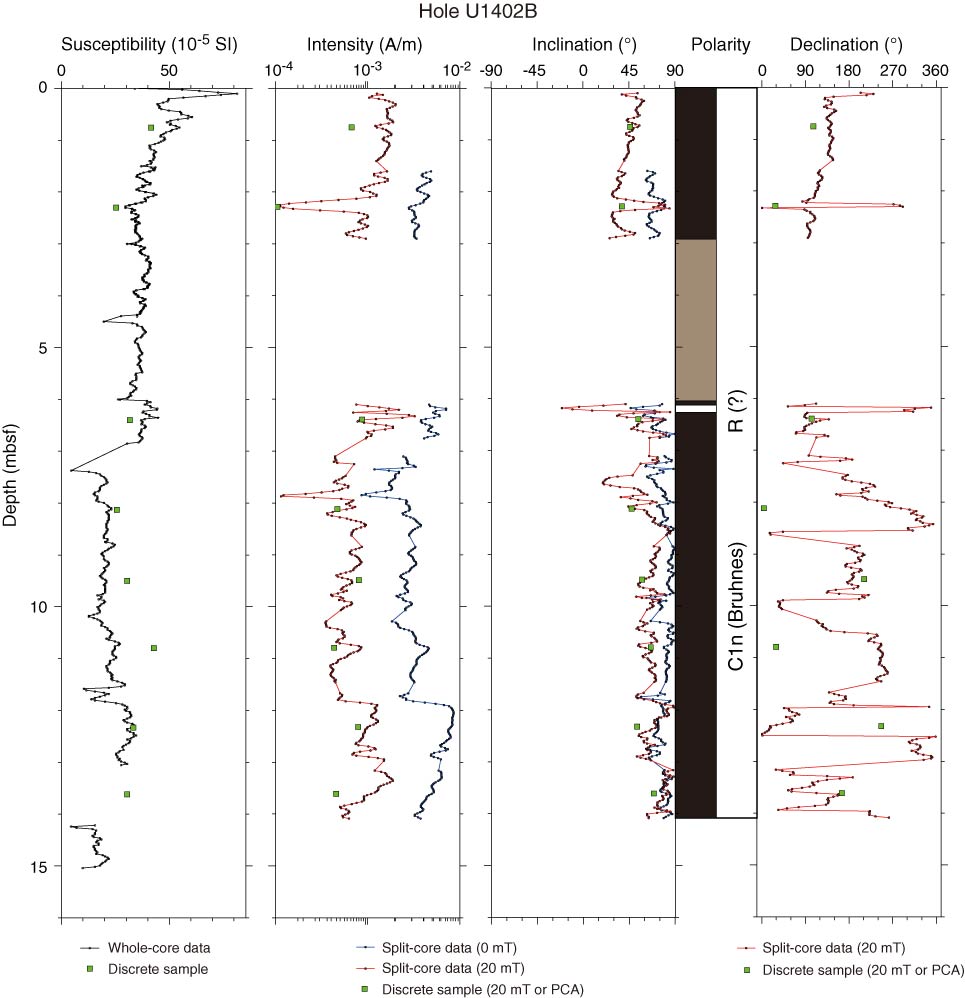
Figure F5. Plots of downhole variation of magnetic susceptibility and paleomagnetism data, Hole U1402B. Declinations are shown in sample coordinates (not reoriented to geographical coordinates). For discrete sample data, if the samples were analyzed by principal component analysis (PCA; Kirschvink, 1980), then directions are shown according to PCA declination and inclination. Otherwise, directions after 20 mT demagnetization are shown.
Previous | Close | Next | Top of page