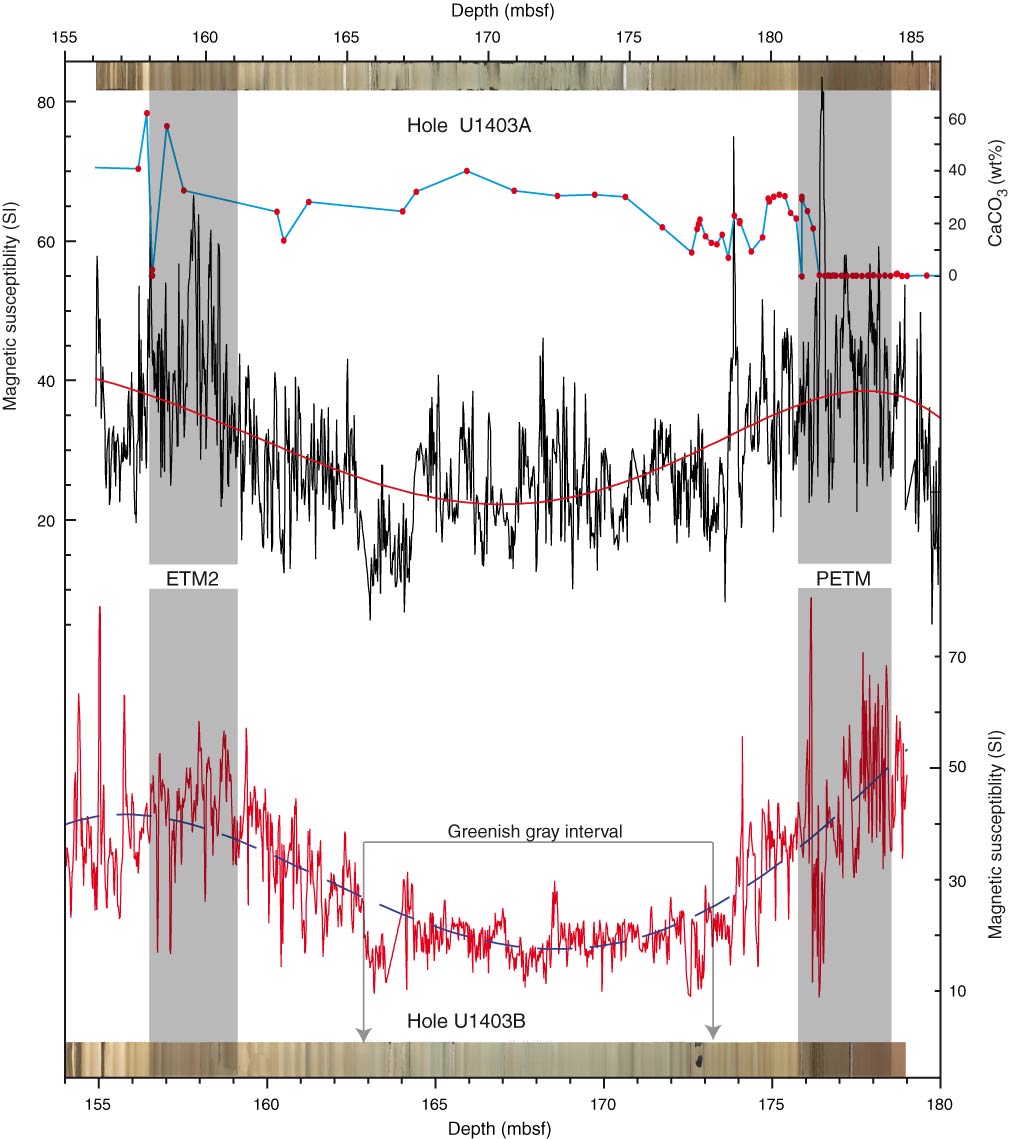
Figure F13. Plots of magnetic susceptibility and carbonate content variations in the interval spanning the Eocene Thermal Maximum 2 (ETM2) and Paleocene/Eocene Thermal Maximum (PETM) hyperthermal events, Site U1403. Magnetic susceptibility measurements were performed at high resolution (1 cm) on section halves using a Bartington MS2E probe (point measurements from the Section Half Multisensor Logger). A fifth-order polynomial fit is shown to indicate a parabolic trend bounding the two events.
Previous | Close | Next | Top of page