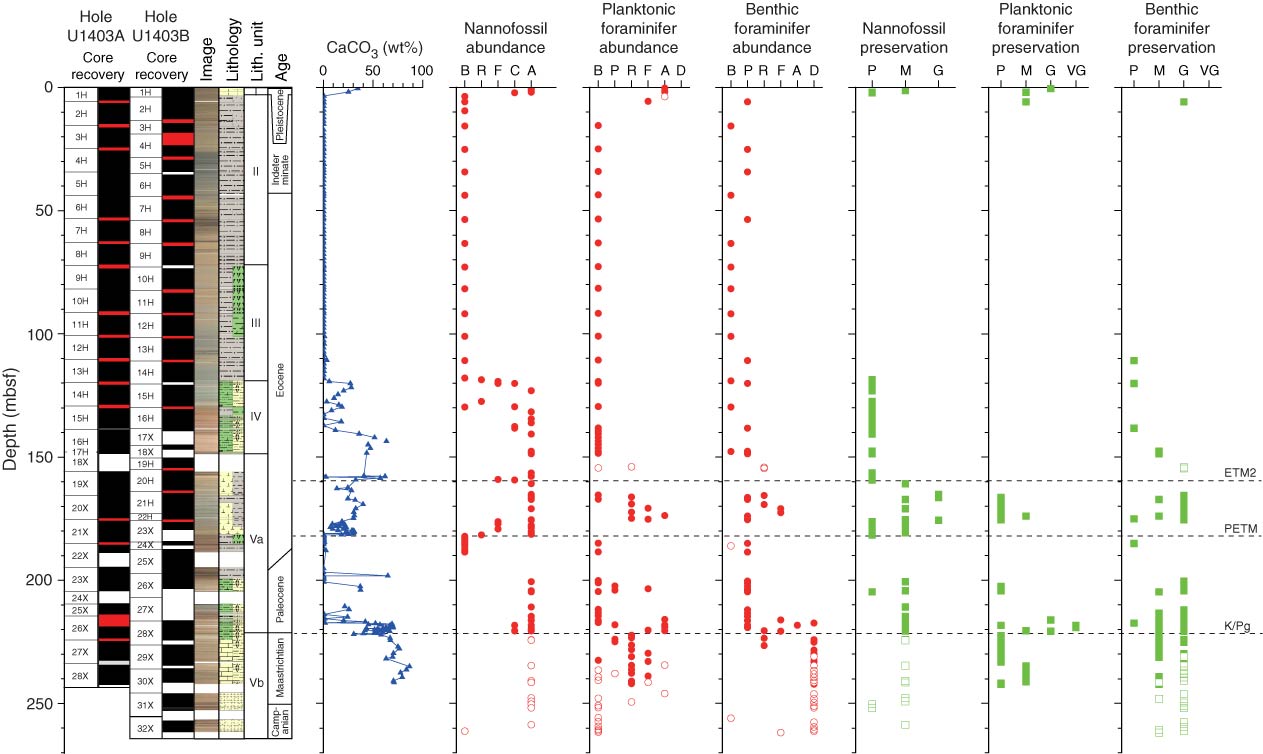
Figure F17. Plots of group abundance and preservation of calcareous and siliceous microfossils, Site U1403. Open and solid symbols represent Holes U1403A and U1403B, respectively. Abundance: B = barren, P = present, R = rare, F = few, C = common, A = abundant, D = dominant. Preservation: P = poor, M = moderate, G = good, VG = very good. ETM2 = Eocene Thermal Maximum 2, PETM = Paleocene/Eocene Thermal Maximum, K/Pg = Cretaceous/Paleogene boundary.
Previous | Close | Next | Top of page