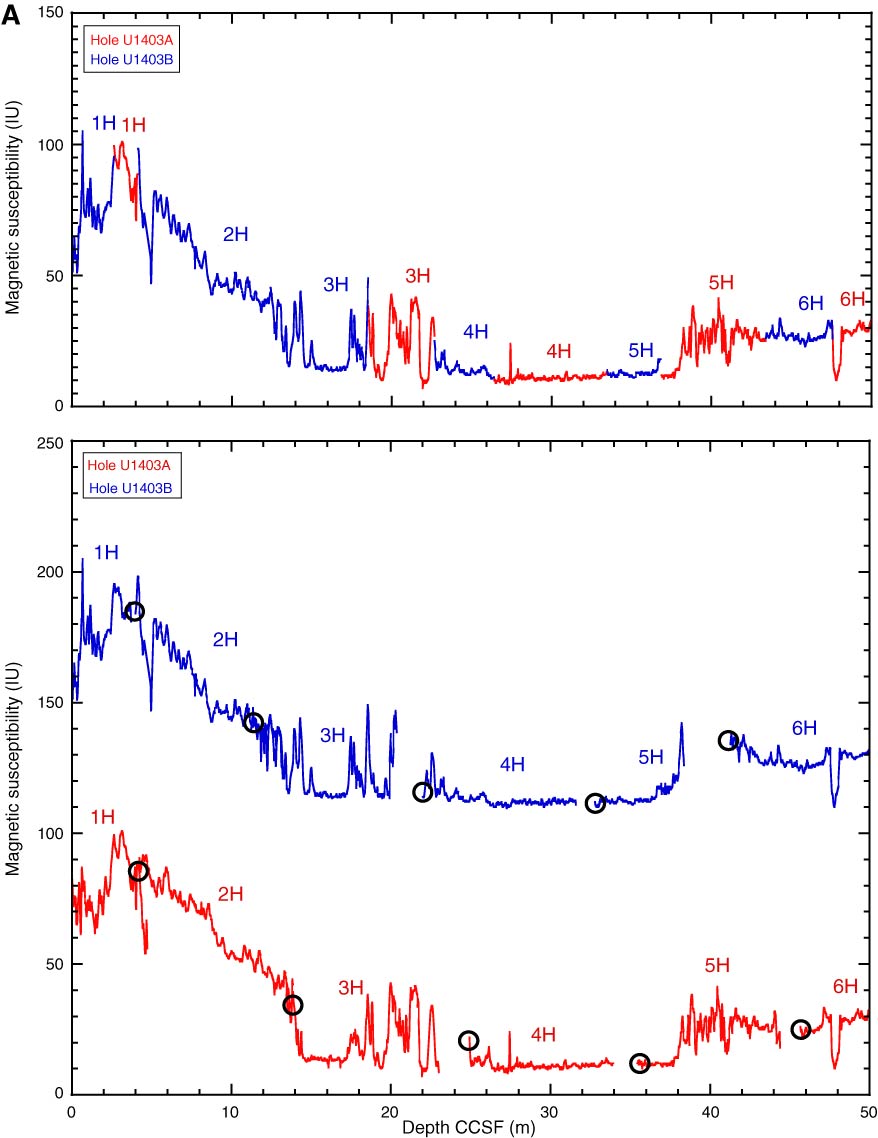
Figure F33. Plots of magnetic susceptibility, Site U1403. Top panels show the spliced section for each interval of the splice. Bottom panels show Hole U1403B data offset by 100 IU from Hole U1403A to aid visualization. Open circles indicate core tops. A. 0–50 m CCSF. (Continued on next five pages.)
Previous | Close | Next | Top of page