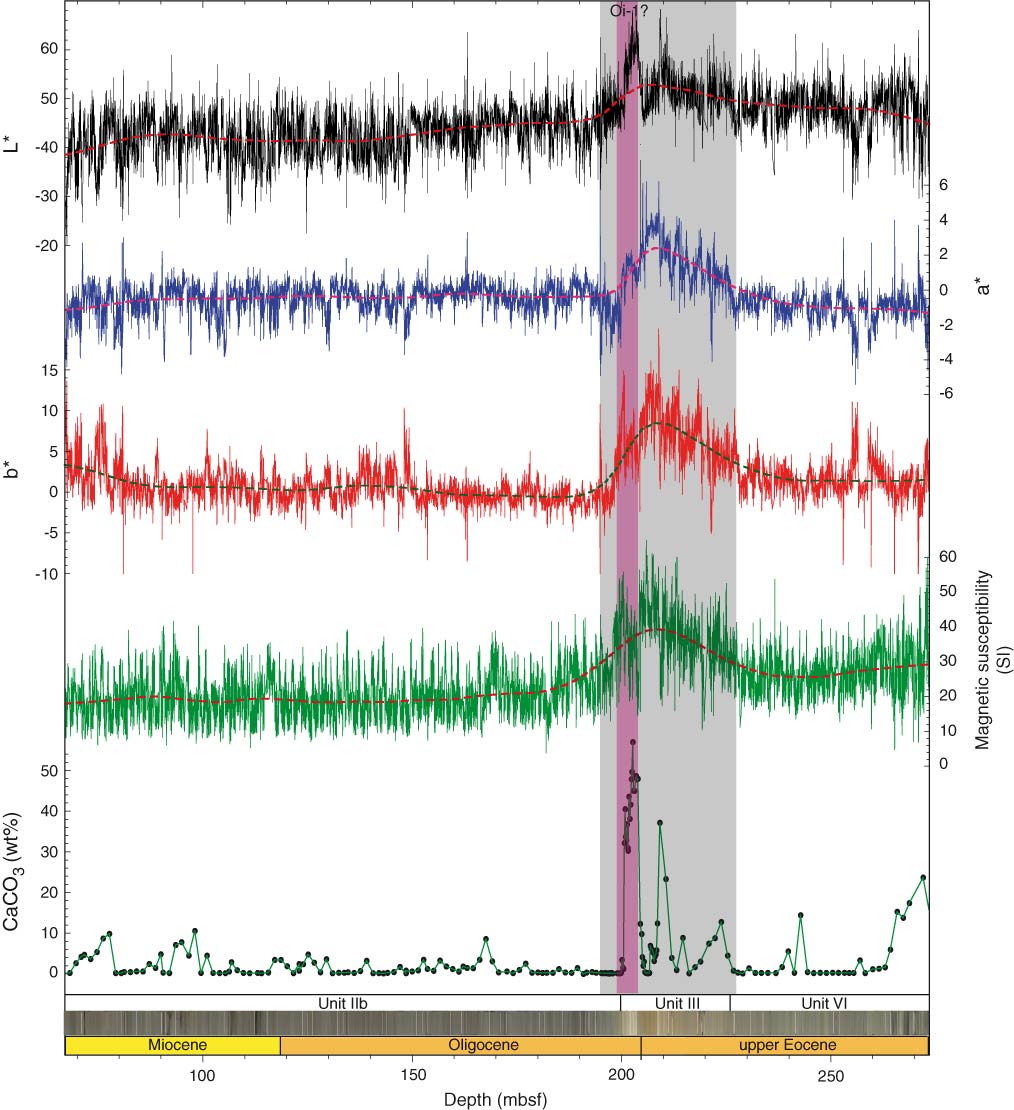
Figure F12. Plots of color reflectance, magnetic susceptibility, and carbonate content, Hole U1404A. A 15% weighted average of each series is shown to indicate long-term trends and to highlight the Eocene–Oligocene transition. Gray area represents high variations in color reflectance, magnetic susceptibility, and calcium carbonate, which match the Eocene–Oligocene transition (see text for discussion). Pink area may correspond to the Oi-1 glacial event according to sand-sized lithic grain data (see “Sand-sized lithic grains”).
Previous | Close | Next | Top of page