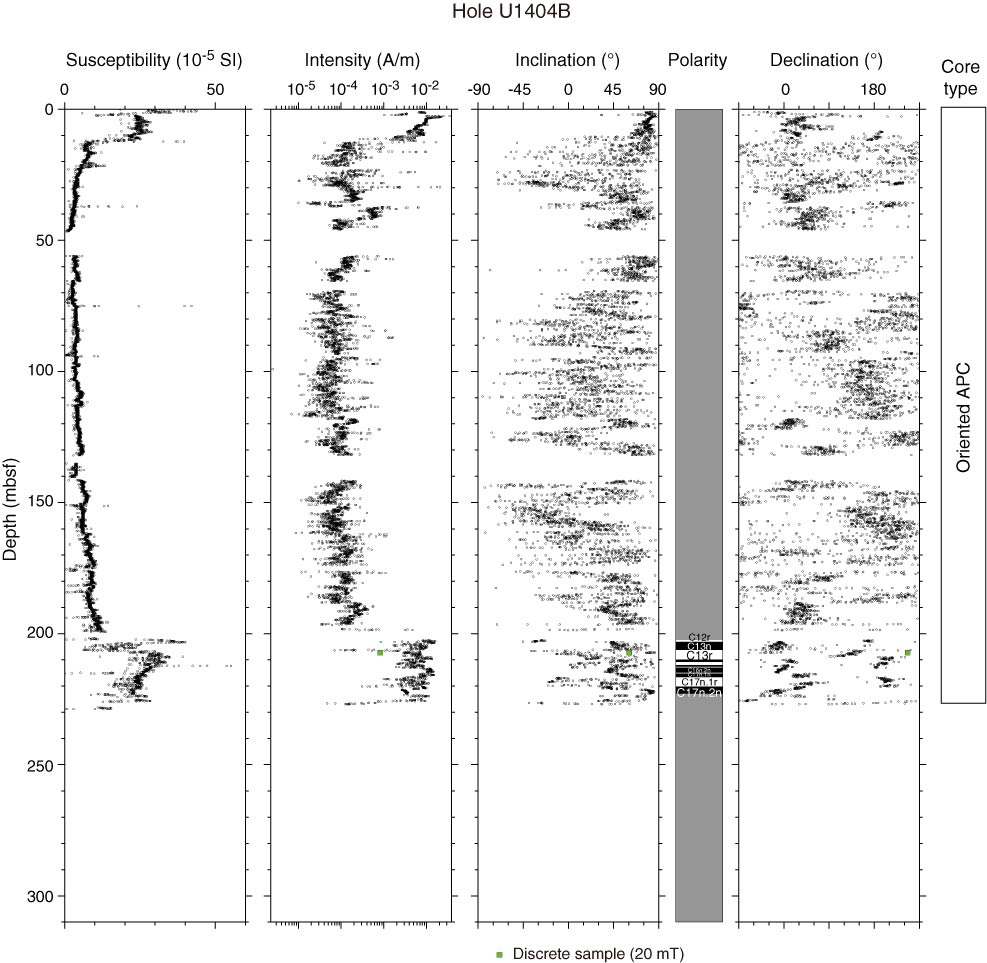
Figure F20. Plots of downhole variation of magnetic susceptibility and paleomagnetism data, Hole U1404B. Magnetization intensity, inclination, and declination are after 20 mT demagnetization. Directions are shown in geographic coordinates. APC = advanced piston corer. Polarity: black = normal chron, white = reversed chron, gray = unidentified interval.
Previous | Close | Next | Top of page