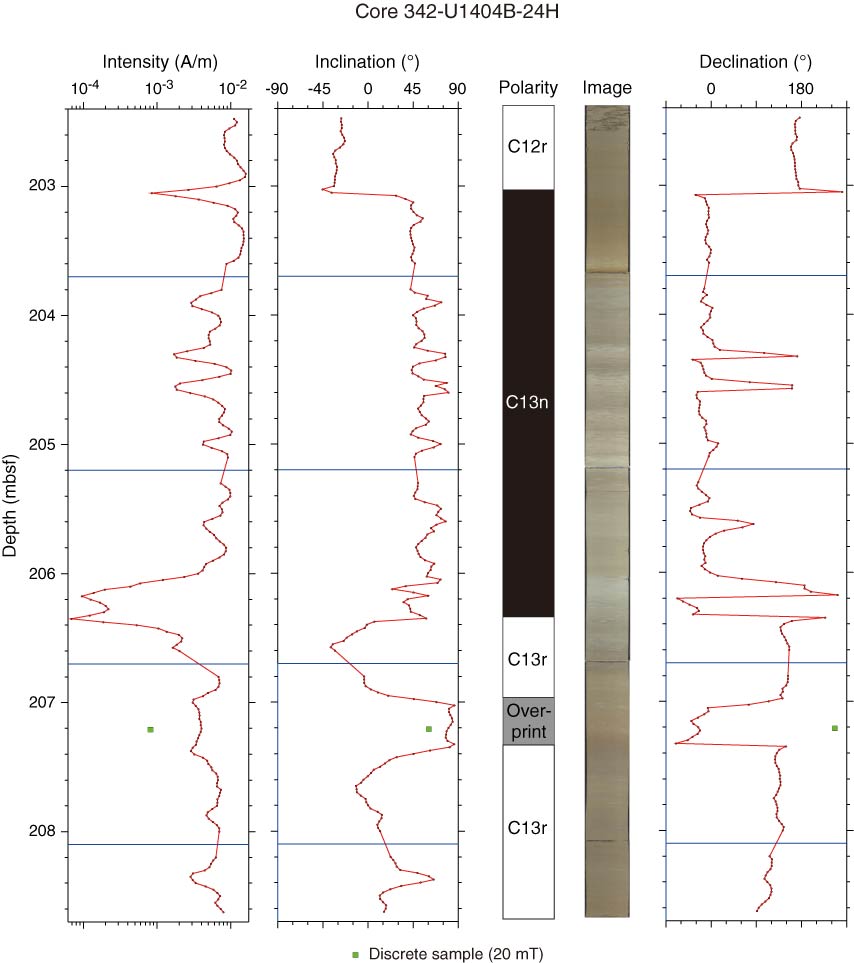
Figure F24. Plots of downhole variation of paleomagnetism data, Core 342-U1404B-24H. Blue lines indicate section breaks. Declination is after 20 mT demagnetization. Directions are shown in geographic coordinates. For discrete sample data, intensity and directions after 20 mT demagnetization are shown. Polarity: black = normal chron, white = reversed chron, gray = outlier caused by drilling overprint.
Previous | Close | Next | Top of page