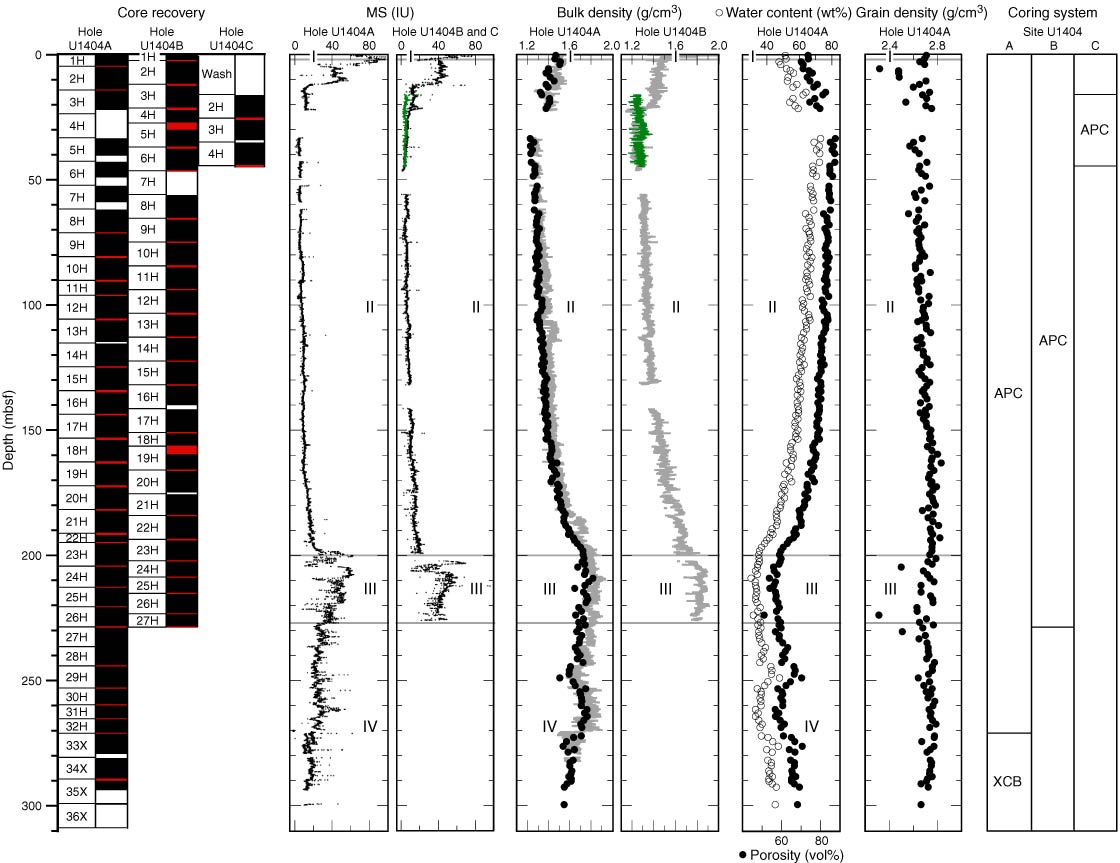
Figure F33. Plots of magnetic susceptibility (MS), bulk density (gray line = GRA density from Whole-Round Multisensor Logger, circles = moisture and density analysis from discrete samples), water content, porosity, and grain density, Site U1404. Green = data from Hole U1404C. Core recovery: black = recovered, white = not recovered, red = overlap. Horizontal gray lines indicate lithostratigraphic unit boundaries (see “Lithostratigraphy”). APC = advanced piston corer, XCB = extended core barrel.
Previous | Close | Next | Top of page