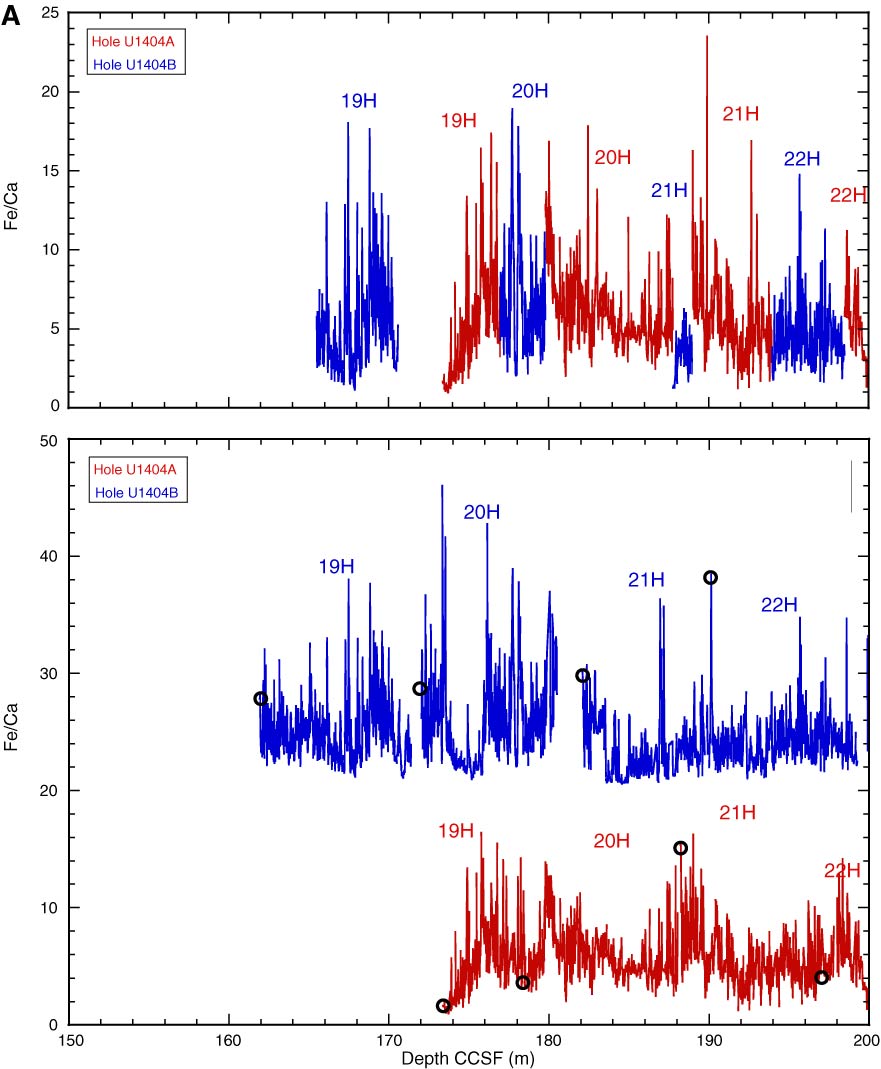
Figure F38. Plots of postcruise X-ray fluorescence Fe/Ca measurements, Site U1404. Top panels show the spliced section for each interval of the splice. Bottom panels show all complete Fe/Ca records. Data from Hole U1404B is offset by 20 to aid visualization. Open circles indicate core tops, excluding culled data from disturbed intervals. A. 150–200 m CCSF. (Continued on next page.)
Previous | Close | Next | Top of page