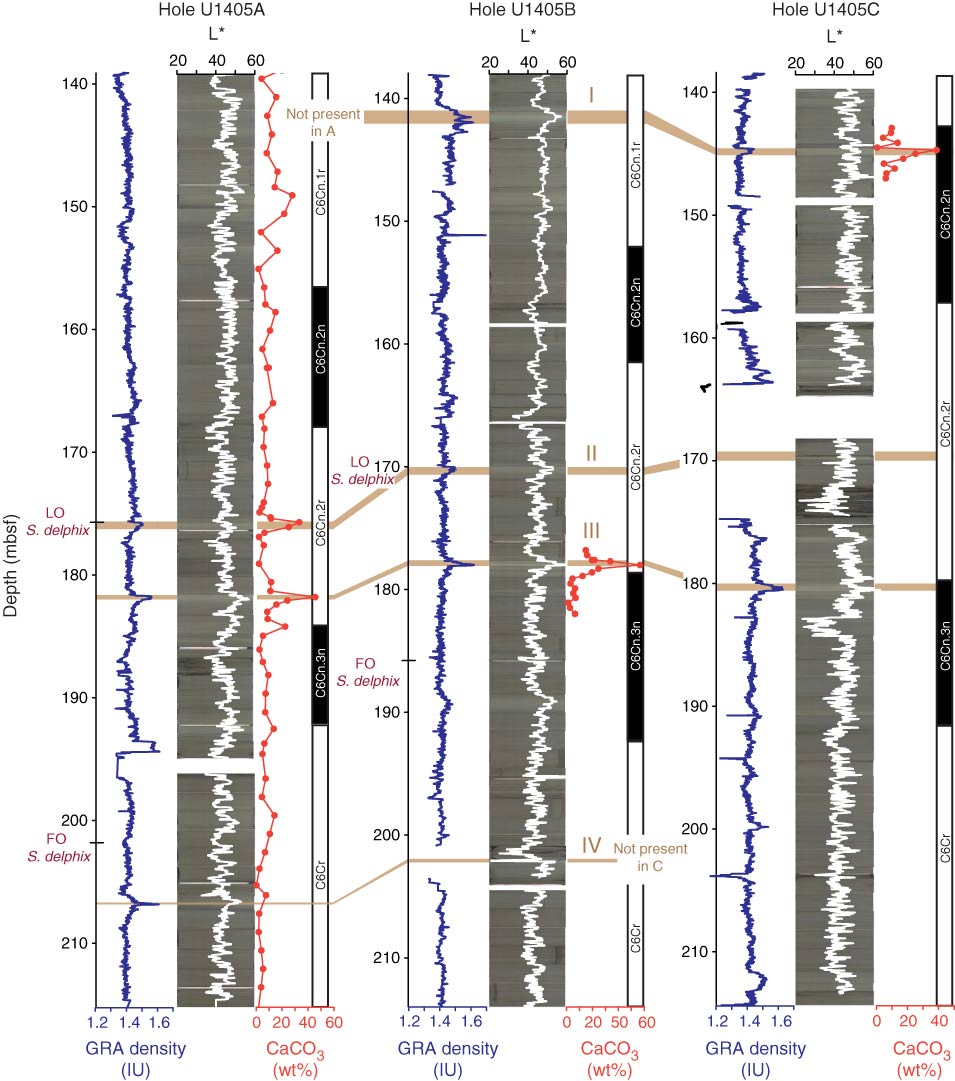
Figure F11. Plots of gamma ray attenuation (GRA) density, color reflectance (L*), and carbonate content of Subunit IIb around the Oligocene–Miocene transition, Site U1405. Layers I–IV (based on direct observation) are indicated by light brown bands. Relative time is indicated by magnetostratigraphy and the first occurrence (FO) and last occurrence (LO) of Sphenolithus delphix (Holes U1405A and U1405B). The true color of section line scan images may be distorted in print.
Previous | Close | Next | Top of page