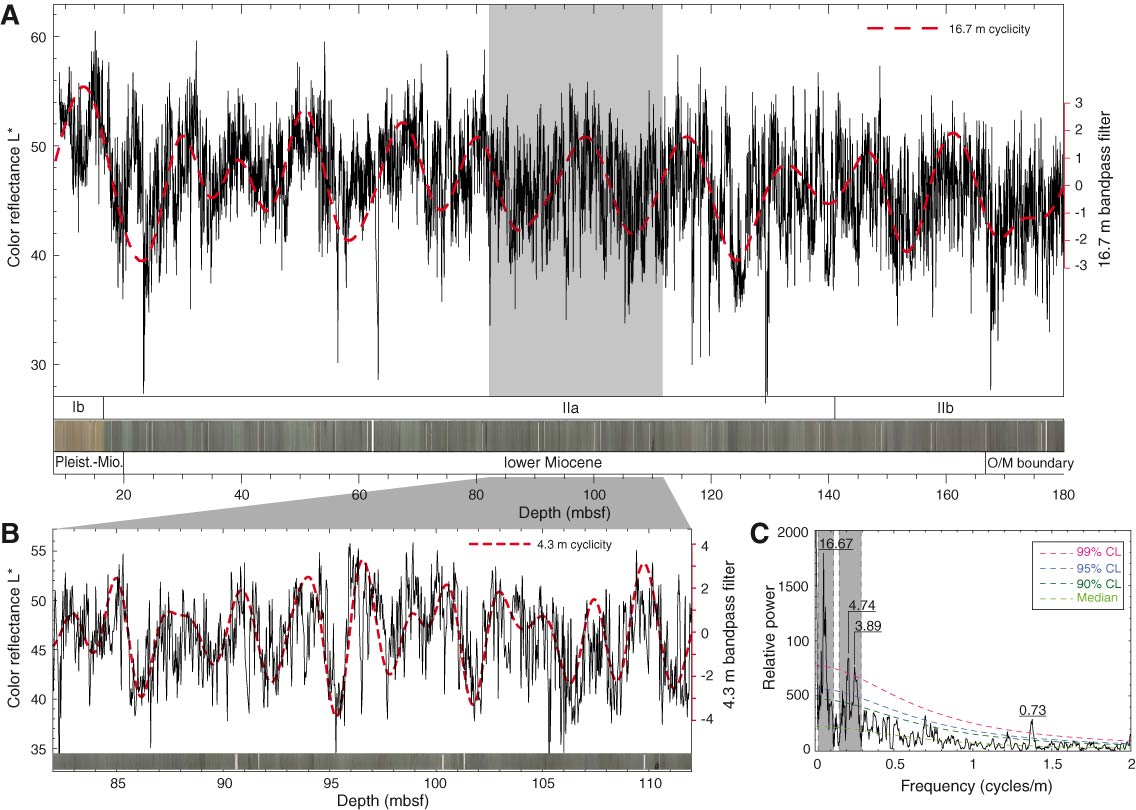
Figure F14. Plots of color reflectance L* variations, Hole U1405A. Measurements were performed at high resolution (2.5 cm) on section halves using spectrophotometry (point measurements from Section Half Multisensor Logger). A. L* variations at 9–180 mbsf. A bandpass Gaussian filter output highlights 16.7 m cyclicity. B. Expanded view of the gray area in A. A bandpass Gaussian filter output highlights 4.3 m cyclicity. C. Power spectrum of A with red noise modeling. Only periods (in meters) of peaks exceeding 99% confidence level (CL) are shown. The two gray areas indicate frequency pass bands filtered to isolate the 16.7 and 4.3 m cyclicities shown in A and B. Note that only the low-frequency portion of the spectrum (0–2 cycles/m) is plotted to highlight the prominent 16.7 and 4.3 m cyclicities (see text for discussion).
Previous | Close | Next | Top of page