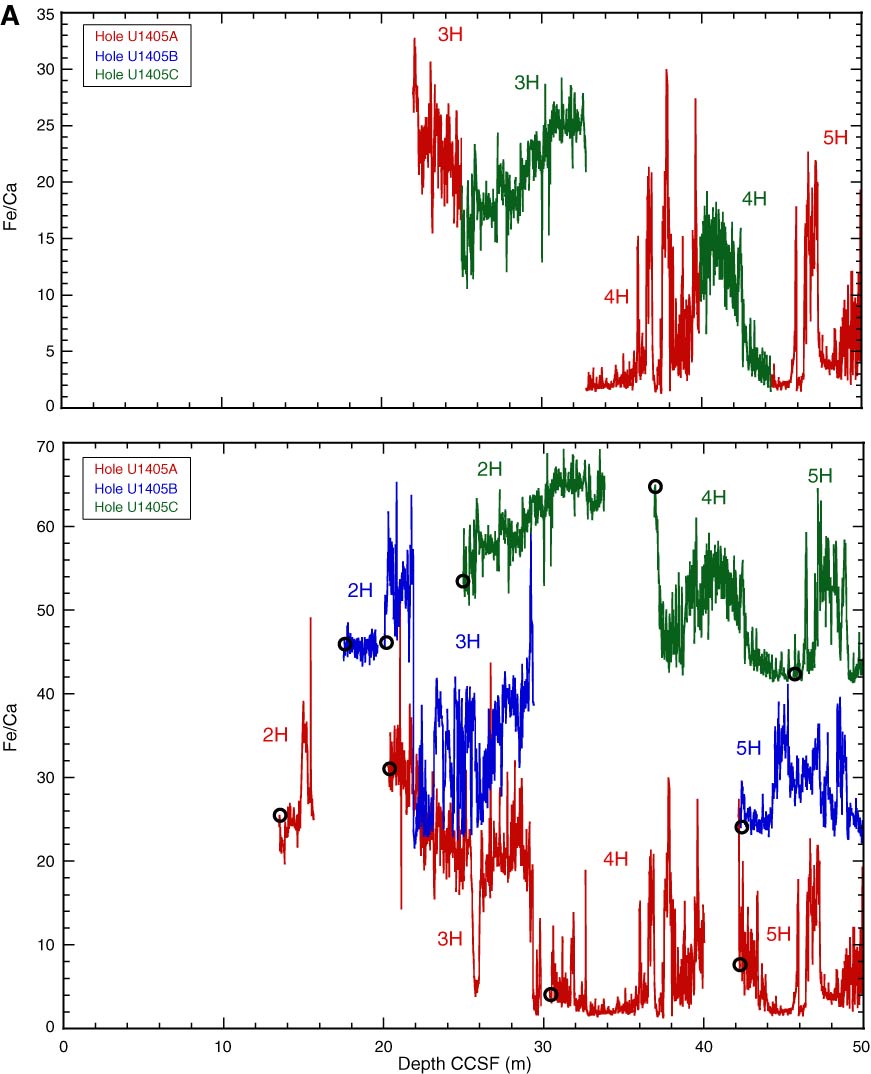
Figure F37. Plots of Fe/Ca from XRF core scanning, Site U1405. Top panels show the spliced section for each interval of the scanned splice. Bottom panels show all complete Fe/Ca records. Data from Holes U1405B and U1405C are offset by 20 and 40, respectively, to aid visualization. Open circles indicate core tops. A. 0–50 m CCSF. (Continued on next five pages.)
Previous | Close | Next | Top of page