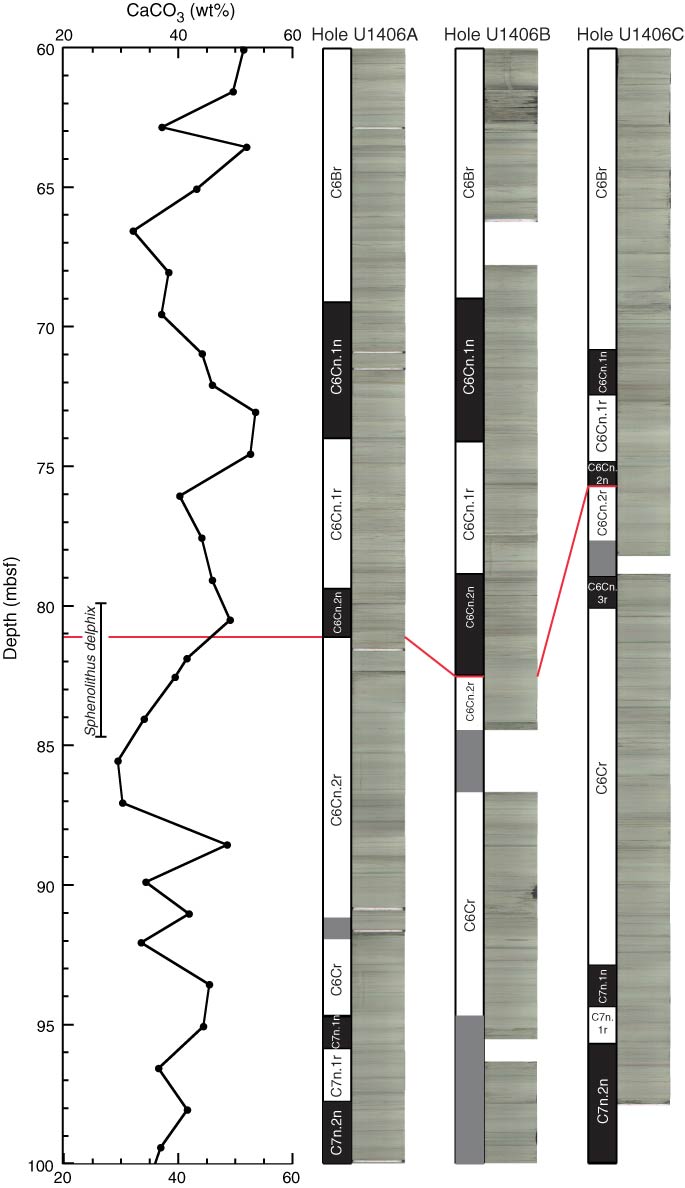
Figure F11. Plot and core images of lithologic expression of the Oligocene–Miocene transition, Site U1406. Red lines indicate splice ties (see “Stratigraphic correlation”). The Oligocene/Miocene boundary is approximated by the first occurrence and last occurrence datums of the nannofossil taxon Sphenolithus delphix and defined by the base of Chron C6Cn.2n.
Previous | Close | Next | Top of page