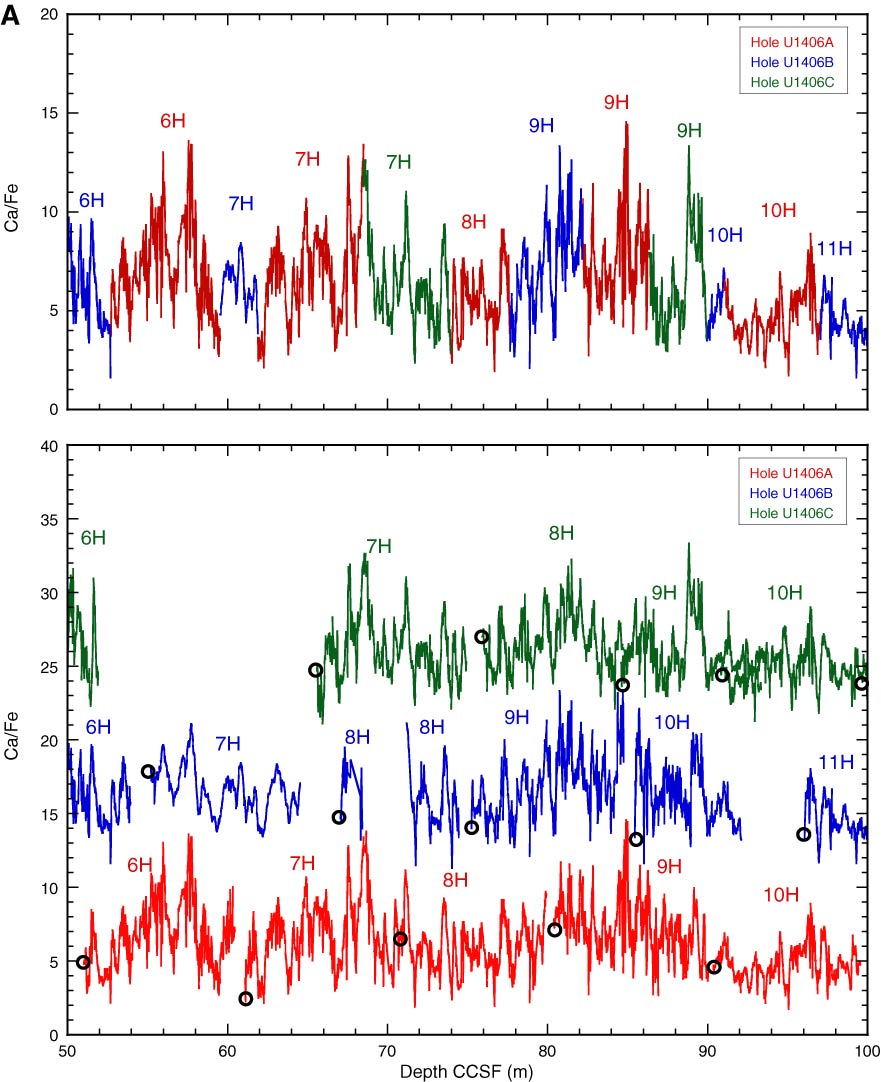
Figure F32. Plots of X-ray fluorescence scanning data for intervals where Ca/Fe data better reflects the correlation between holes, Site U1406. Top panels are the spliced section for each interval of the splice, and bottom panels Ca/Fe are records from all three holes. Data from Holes U1406B and U1406C are offset by 10 and 20, respectively, to aid visualization. Open circles indicate core tops. A. 50–100 m CCSF. (Continued on next two pages.)
Previous | Close | Next | Top of page