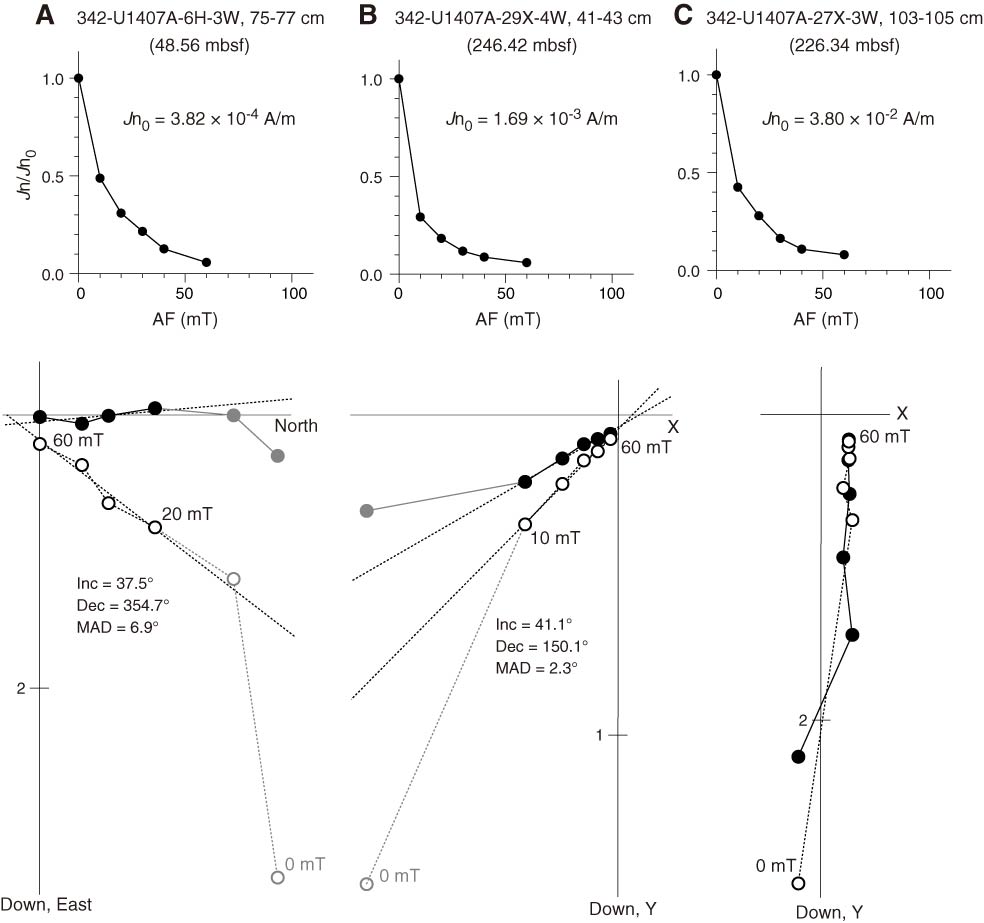
Figure F27. Plots of representative alternating field (AF) demagnetization results for discrete paleomagnetism samples, Site U1407. Upper plots show intensity variation with progressive demagnetization, and lower plots show vector endpoints of paleomagnetism directions on orthogonal vector diagrams (i.e., Zijderveld plots). Vector diagrams indicate well-resolved characteristic remanent magnetization (ChRM) directions from the (A) advanced piston corer and (B) extended core barrel (XCB) intervals, whereas (C) some samples from the XCB intervals do not show stable components. Solid circles = horizontal projections, open circles = vertical projections, gray circles = data not used to calculate ChRM direction, black dashed line = ChRM direction. Inc = inclination, Dec = declination, MAD = maximum angle of deviation.
Previous | Close | Next | Top of page