Previous | Close | Next
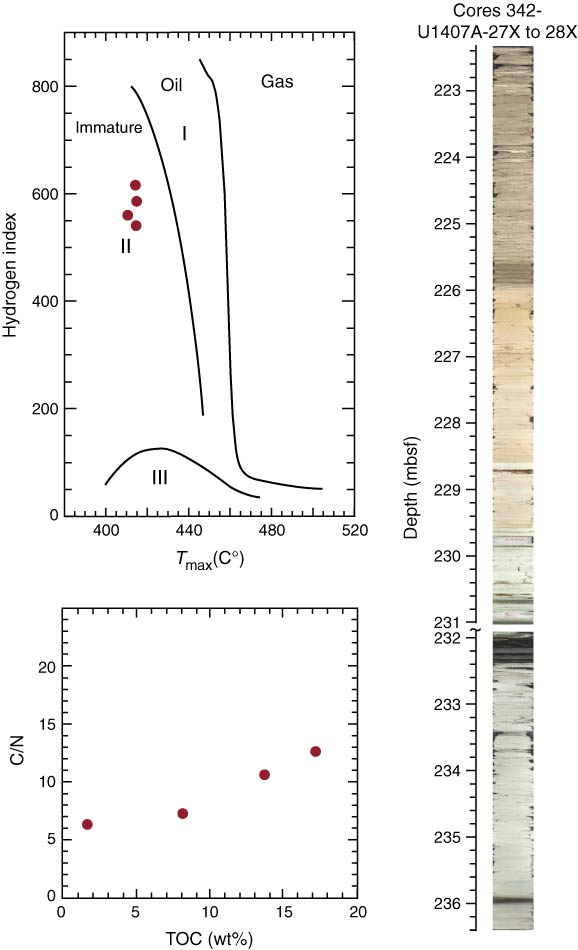
Figure F33. Core image, source-rock van Krevelen–type diagram, and plot of total organic carbon (TOC) for the late Cenomanian–early Turonian and Oceanic Anoxic Event 2 interval, Hole U1407A.
Previous | Close | Next | Top of page