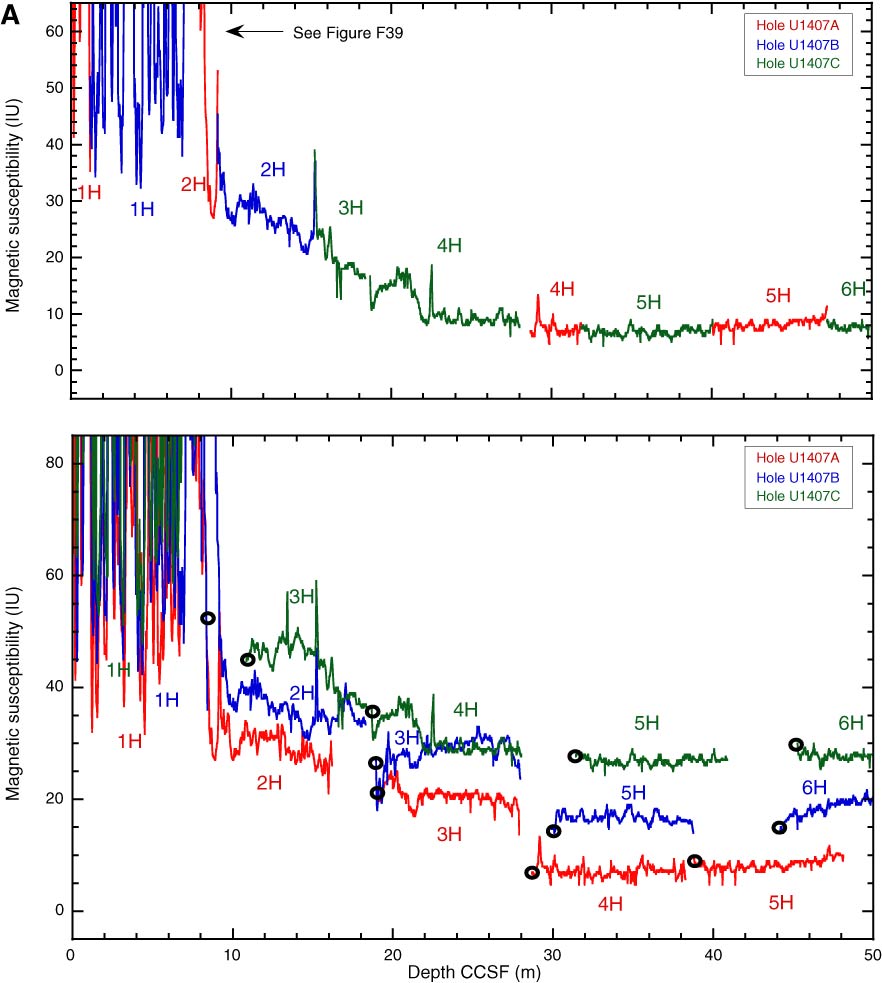
Figure F37. Plots of magnetic susceptibility data, Site U1407. Top panels show the spliced section for each interval of the splice. Bottom panels show all complete magnetic susceptibility records. Data from Holes U1407B and U1407C are offset by 10 and 20 IU, respectively, to aid visualization. Open circles indicate core tops. A. 0–50 m CCSF. (Continued on next six pages.)
Previous | Close | Next | Top of page