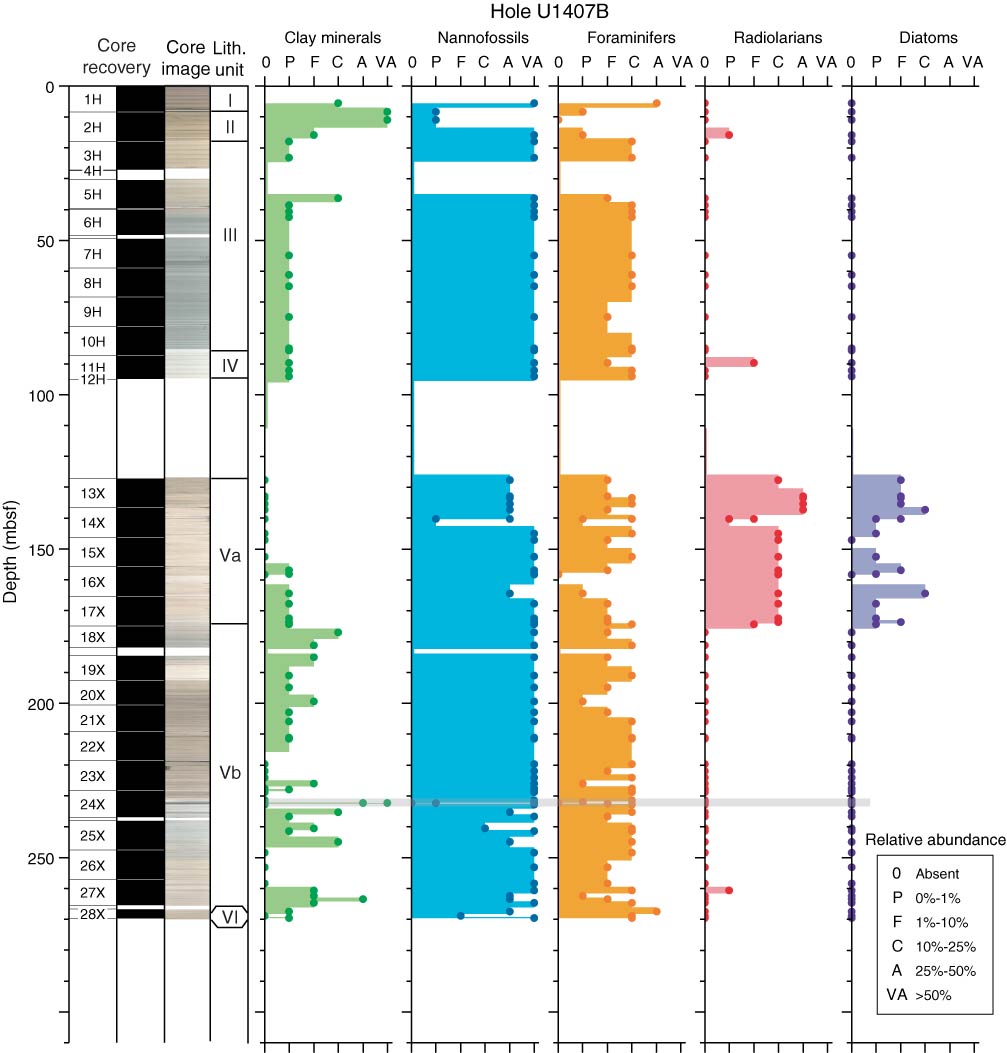
Figure F9. Plots of smear slide results of major biogenic and lithologic components and their relative abundance, Hole U1407B. Gray line represents black shale of the Cenomanian/Turonian Oceanic Anoxic Event 2. VA = very abundant, A = abundant, C = common, F = few, P = present.
Previous | Close | Next | Top of page