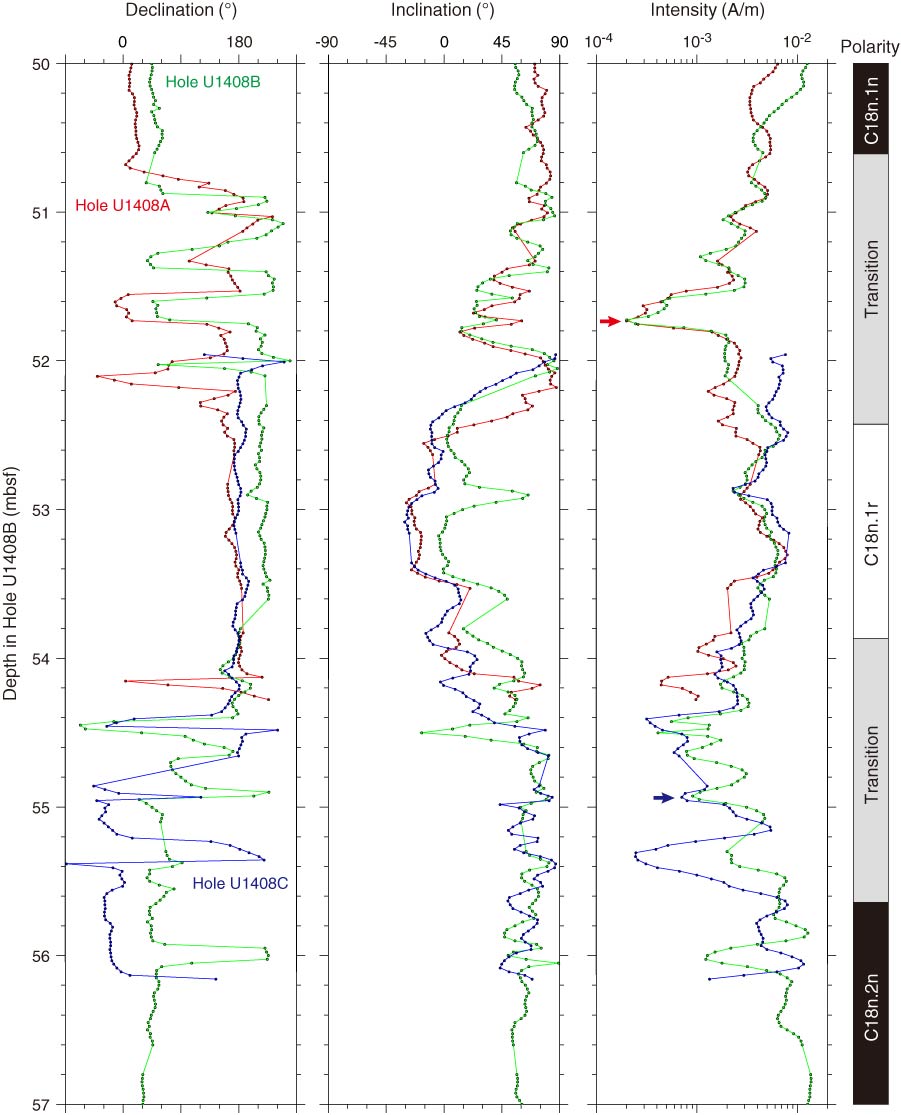
Figure F24. Plots of downhole variation of declination, inclination, and magnetization intensity after 20 mT demagnetization during the Chron C18n.1n–C18n.1r–C18n.2n geomagnetic field transitions. Plots are primarily shown for the Hole U1408B data (green), and data from Holes U1408A and U1408C are shown for the offset depth scale based on the adjusted horizons indicated by arrows (red = Hole U1408A, blue = Hole U1408C) in intensity. Polarity: black = normal chron, white = reversed chron, gray = transitional period.
Previous | Close | Next | Top of page