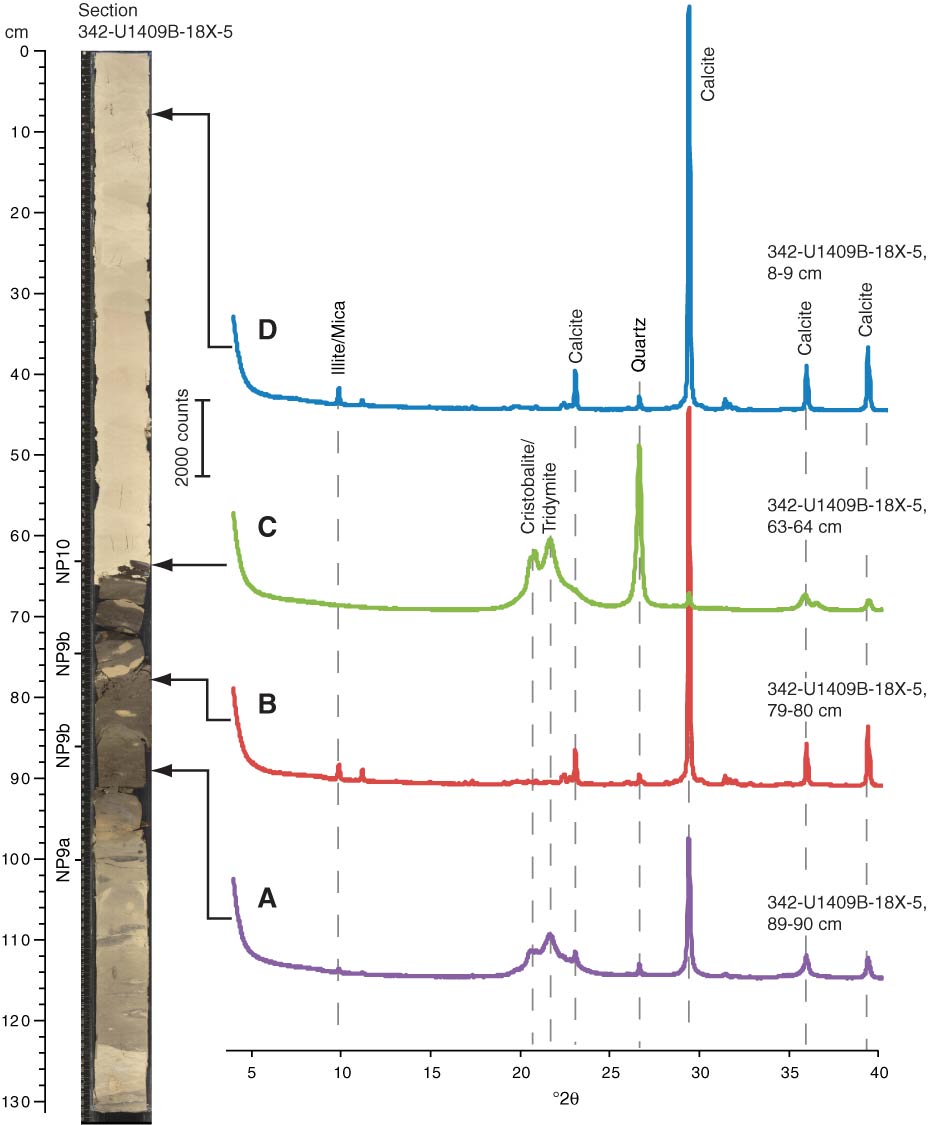
Figure F20. Core images, biostratigraphic datums, and X-ray diffractograms for the Paleocene/Eocene Thermal Maximum (PETM) interval, Hole U1409B. (A, C) Two samples from the dark PETM interval display incipient silicification, as indicated by a double peak caused by the presence of tridymite (20.5° and 21.6°2θ) and possibly also cristobalite (21.9°2θ), whereas samples from the more carbonate-rich clayey level in the center of the (B) chert interval and from (D) above the PETM show a mineralogical background composition with mainly calcite, quartz, and clay minerals like illite.
Previous | Close | Next | Top of page