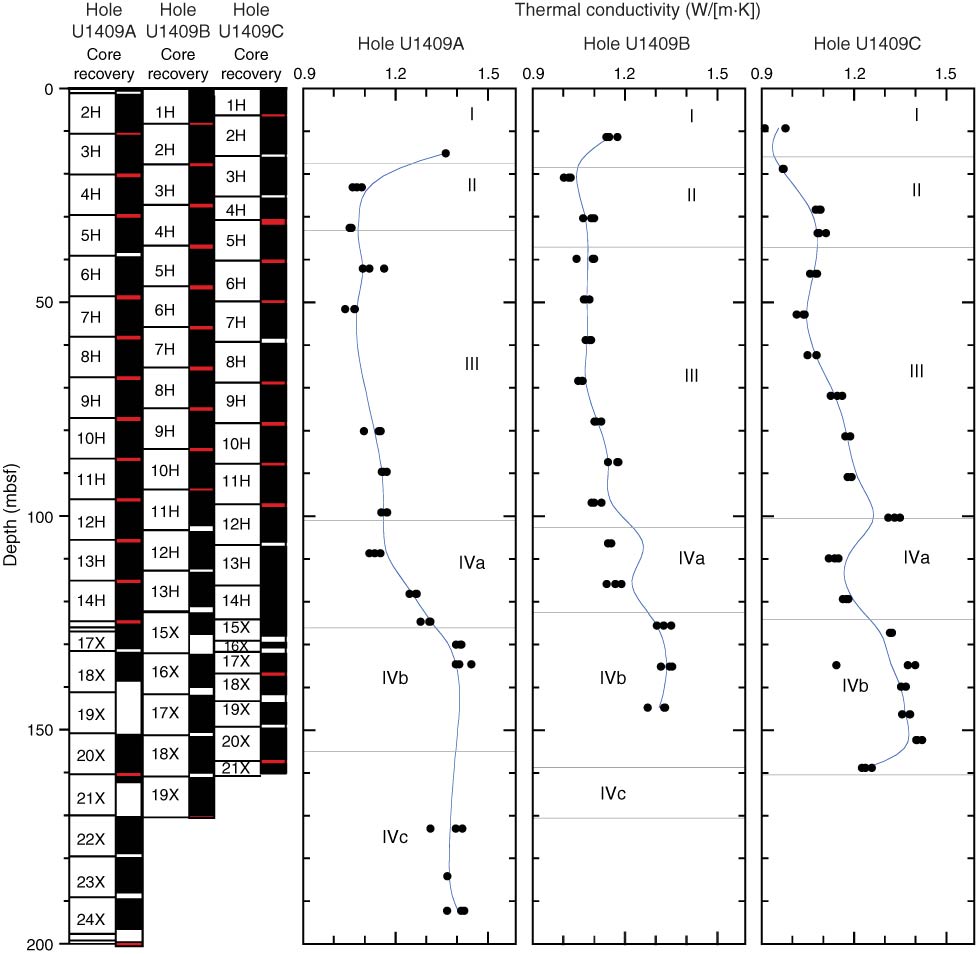
Figure F39. Plots of thermal conductivity measurements, Site U1409. Core recovery: black = recovered, white = not recovered, red = core overlap. Blue lines are the smooth-curve fits for these data sets. Horizontal gray lines indicate lithostratigraphic unit boundaries (see “Lithostratigraphy”).
Previous | Close | Next | Top of page