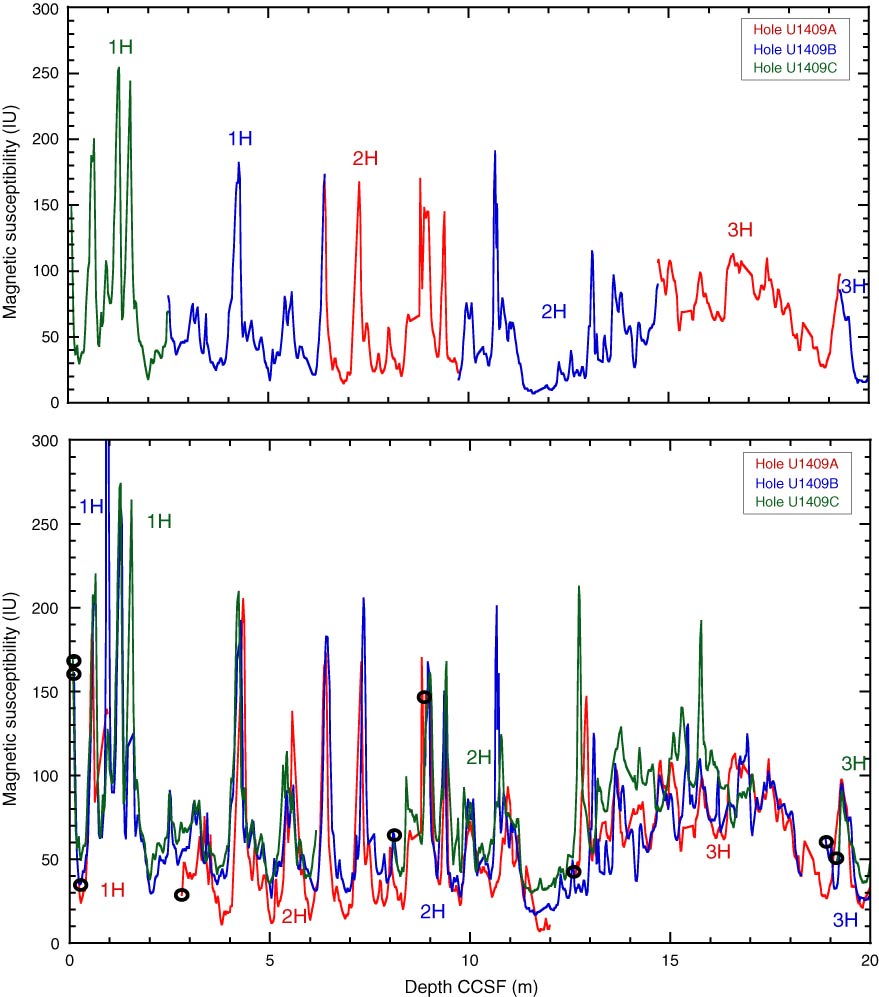
Figure F44. Plots of magnetic susceptibility data showing large-amplitude cycles in magnetic susceptibility, Site U1409. Top panel shows the splice section, and bottom panel shows all complete magnetic susceptibility data sets.

Previous | Close | Top of page