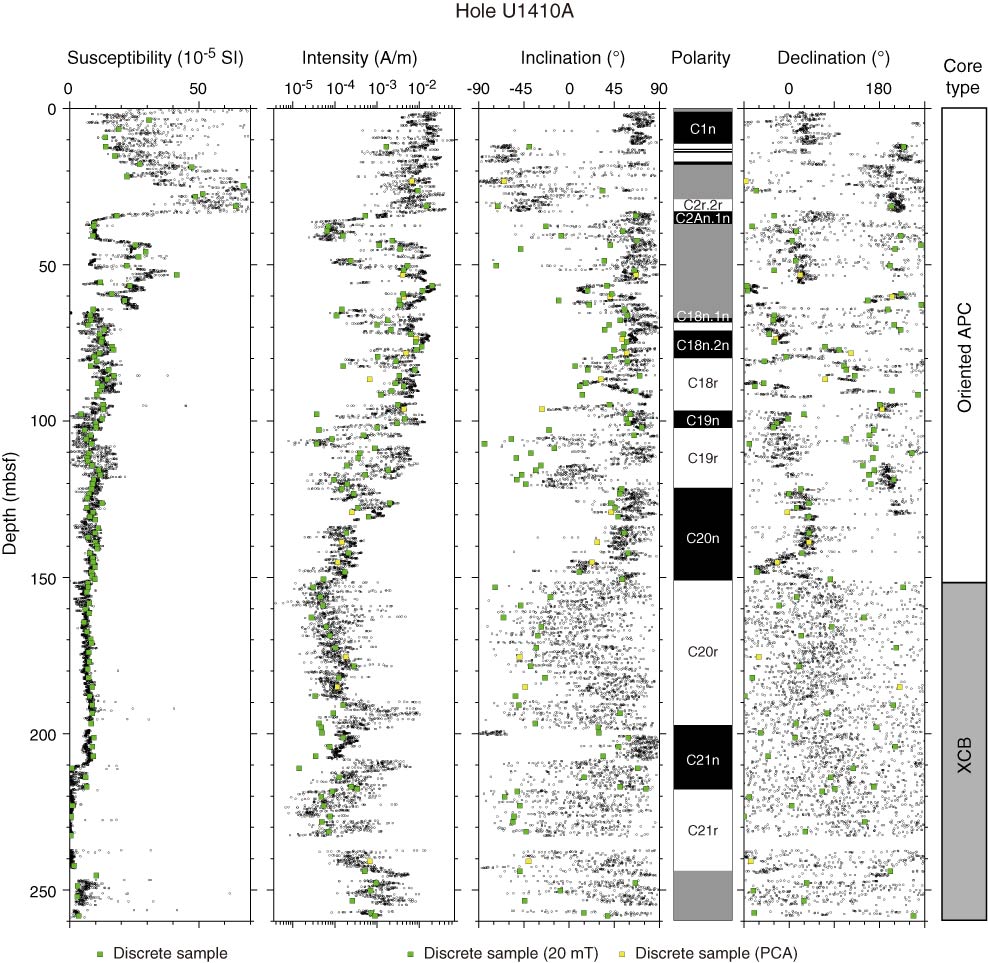
Figure F15. Plots of downhole variation of magnetic susceptibility and paleomagnetism data, Hole U1410A. Magnetization intensity, inclination, and declination are after 20 mT demagnetization. Only oriented advanced piston corer (APC) intervals show directions in geographic coordinates. Directions from extended core barrel (XCB) intervals are shown in sample coordinates. For discrete sample data, if the samples were analyzed by principal component analysis (PCA; Kirschvink, 1980), then directions are shown according to PCA declination and inclination. Otherwise, directions following 20 mT demagnetization are shown. Polarity: black = normal chron, white = reversed chron, gray = unidentified interval.
Previous | Close | Next | Top of page