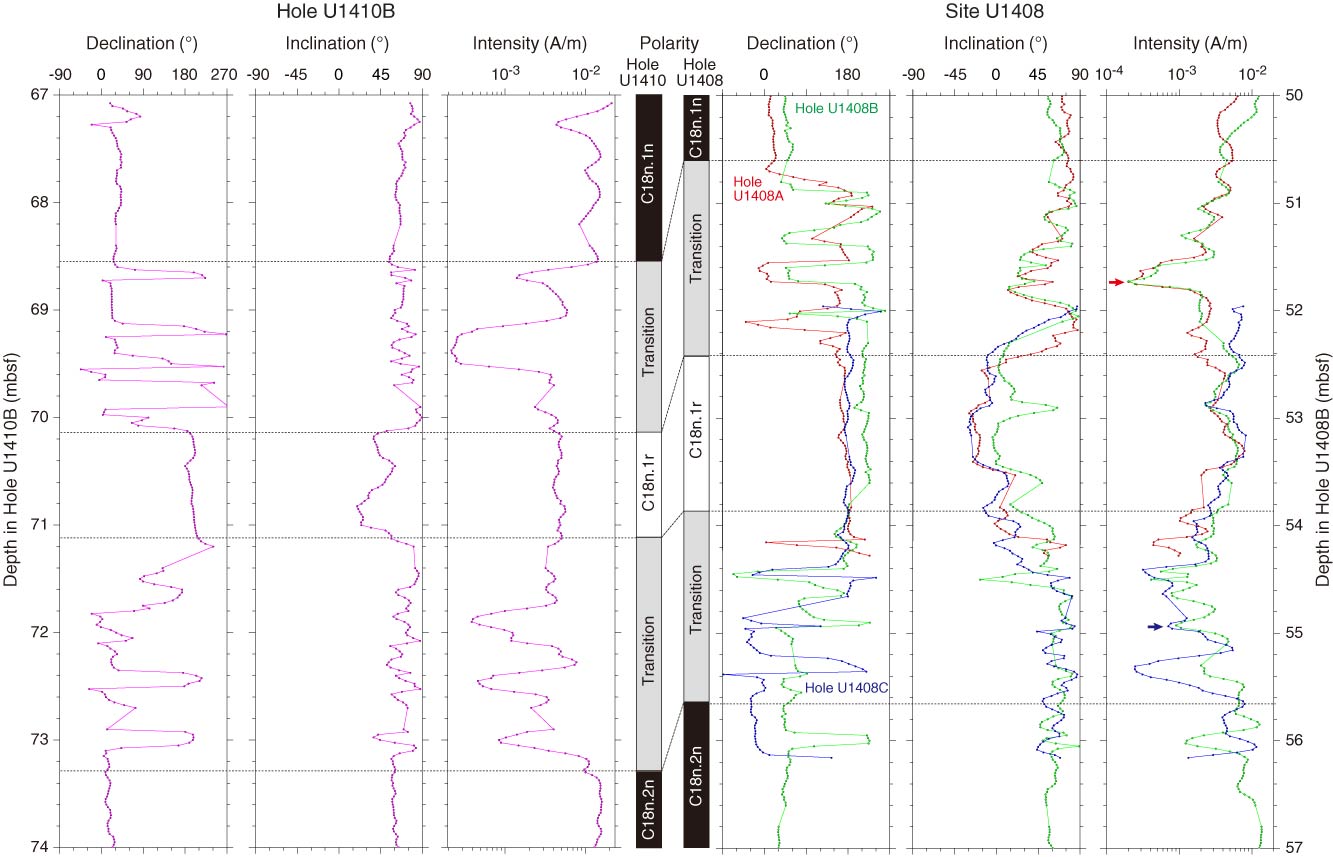
Figure F20. Plots of downhole variation of declination, inclination, and magnetization intensity after 20 mT demagnetization during the Chron C18n.1n–C18n.1r–C18n.2n geomagnetic field transitions in Hole U1410B and at Site U1408. Polarity: black = normal chron, white = reversed chron, gray = transitional period.
Previous | Close | Next | Top of page