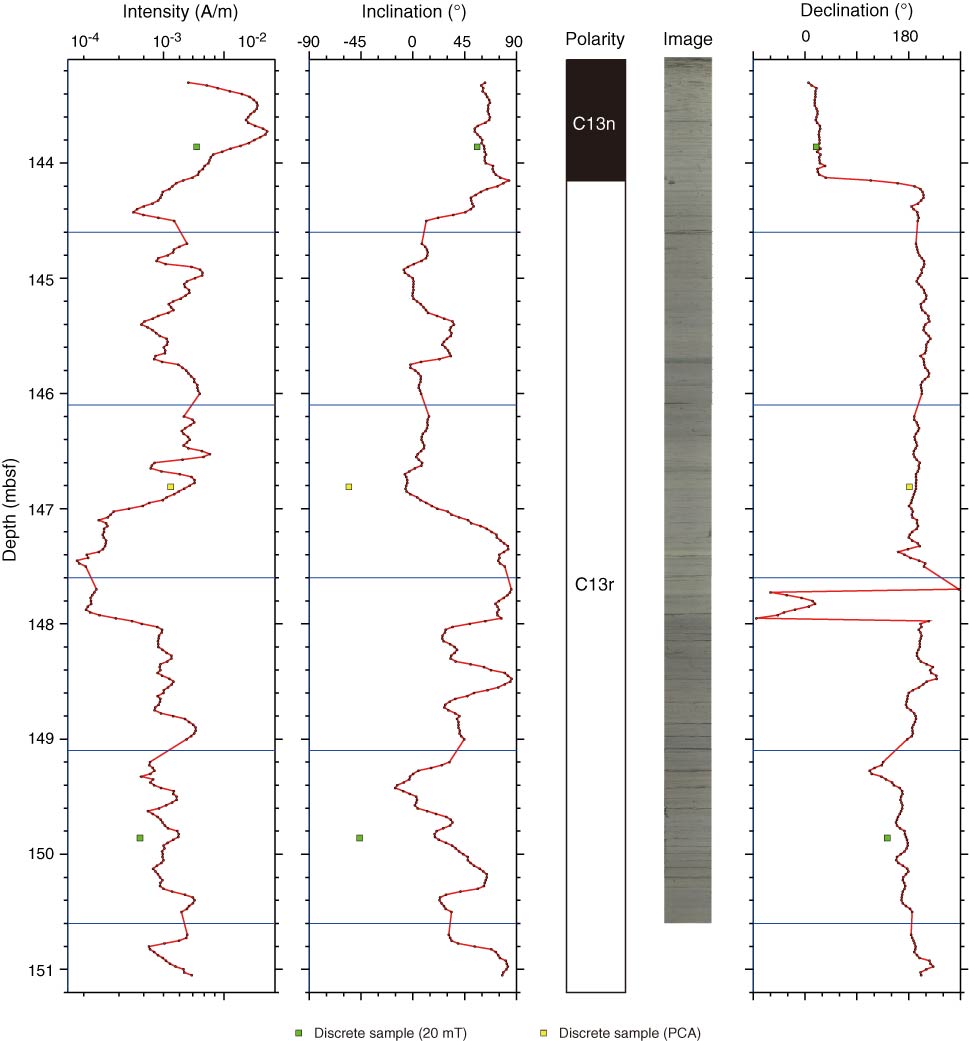
Figure F18. Plots of downhole variation of paleomagnetism data after 20 mT demagnetization for Core 342-U1411B-17H showing the Chron C13n/C13r boundary. Directions are shown in geographic coordinates. For discrete sample data, intensity and directions are after 20 mT demagnetization. Blue lines = section breaks. Polarity: black = normal chron, white = reversed chron. PCA = principal component analysis.
Previous | Close | Next | Top of page