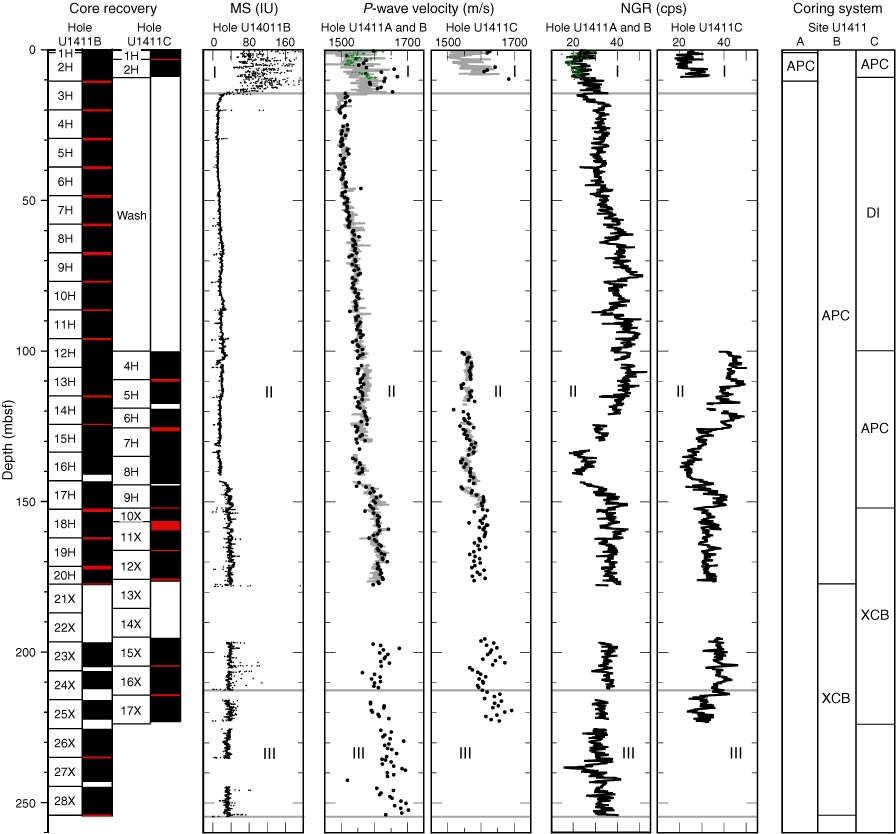
Figure F24. Plots of magnetic susceptibility (MS), P-wave velocity (gray line = P-wave logger data from whole-round sections, black circles = P-wave caliper probe data from section halves, green circles = data from Hole U1411A), and natural gamma radiation (NGR), Site U1411. Core recovery: black = recovered, white = not recovered, red = core overlap. Horizontal gray lines indicate lithostratigraphic unit boundaries (see “Lithostratigraphy”). APC = advanced piston corer, DI = drilled interval, XCB = extended core barrel.
Previous | Close | Next | Top of page