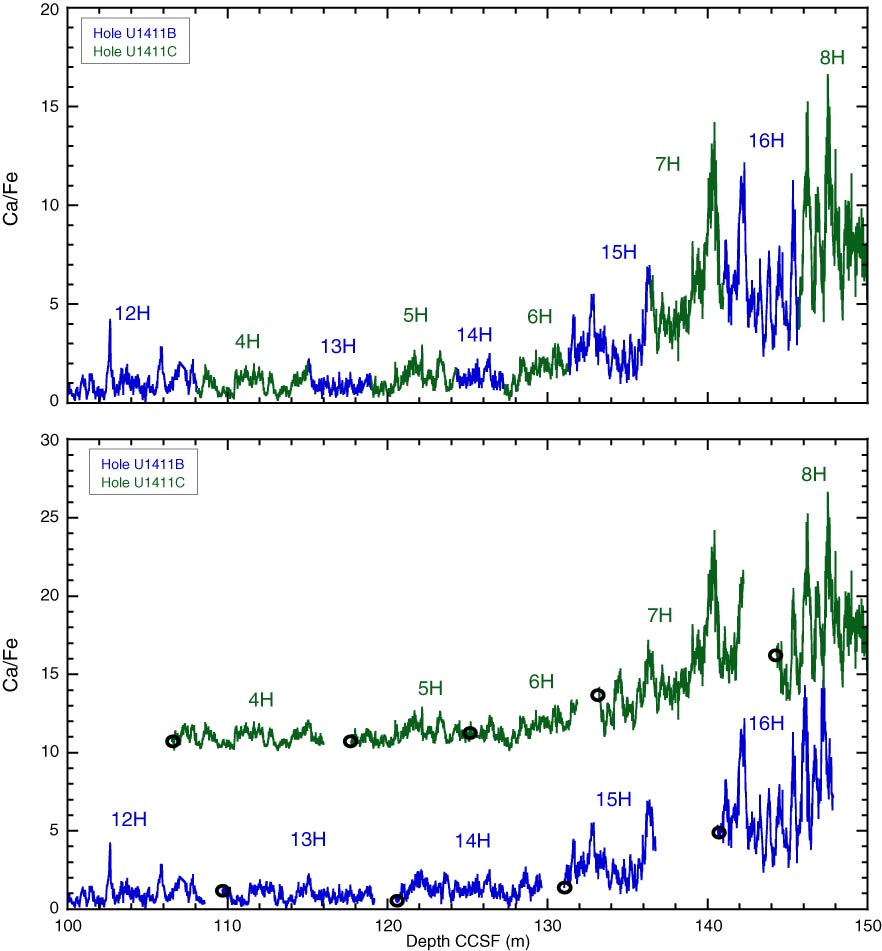
Figure F29. Plot of XRF core scanning Ca/Fe data, Site U1411. Ca/Fe data in this depth interval better reflects the correlation between holes as a result of gaps in shipboard physical property data. Top panel shows the spliced section. Bottom panel shows Ca/Fe records from both holes. Data from Hole U1411C are offset by 10 to aid visualization. Open circles indicate core tops.
Previous | Close | Top of page