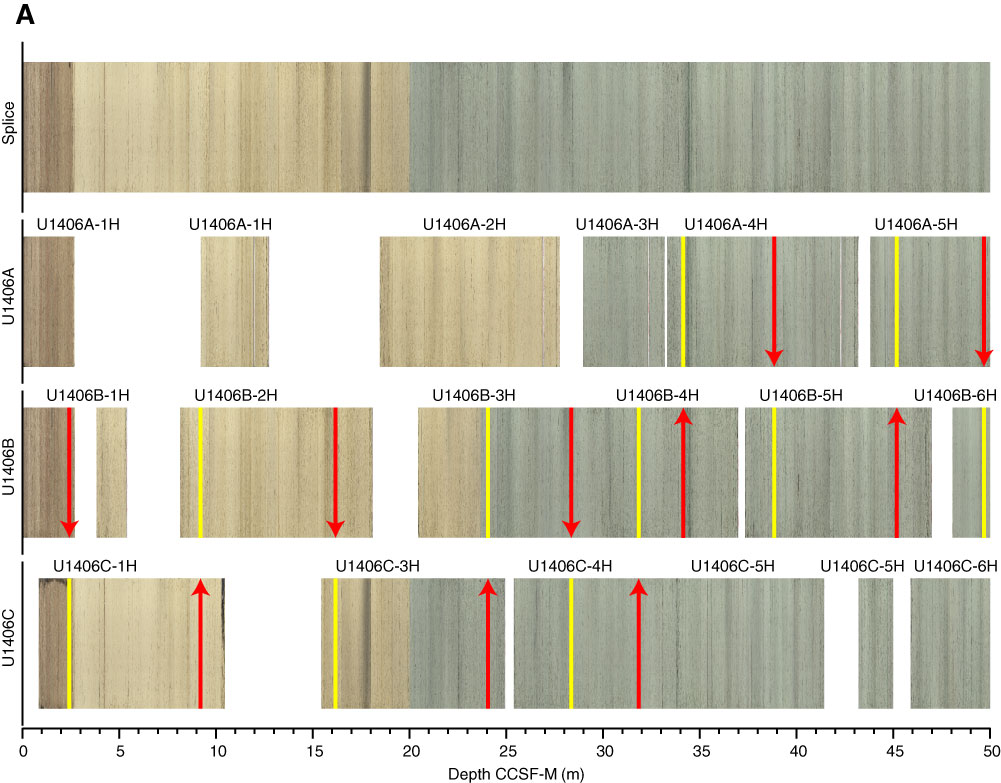
Figure F3. Spliced core images in 50 m intervals, Site U1406. Splice intervals: top = yellow line, bottom = red line. Off-spliced intervals are mapped to the splice using correlative features and corresponding mapping pair tie points. A. 0–50 m CCSF-M. (Continued on next six pages.)
Previous | Close | Next | Top of page