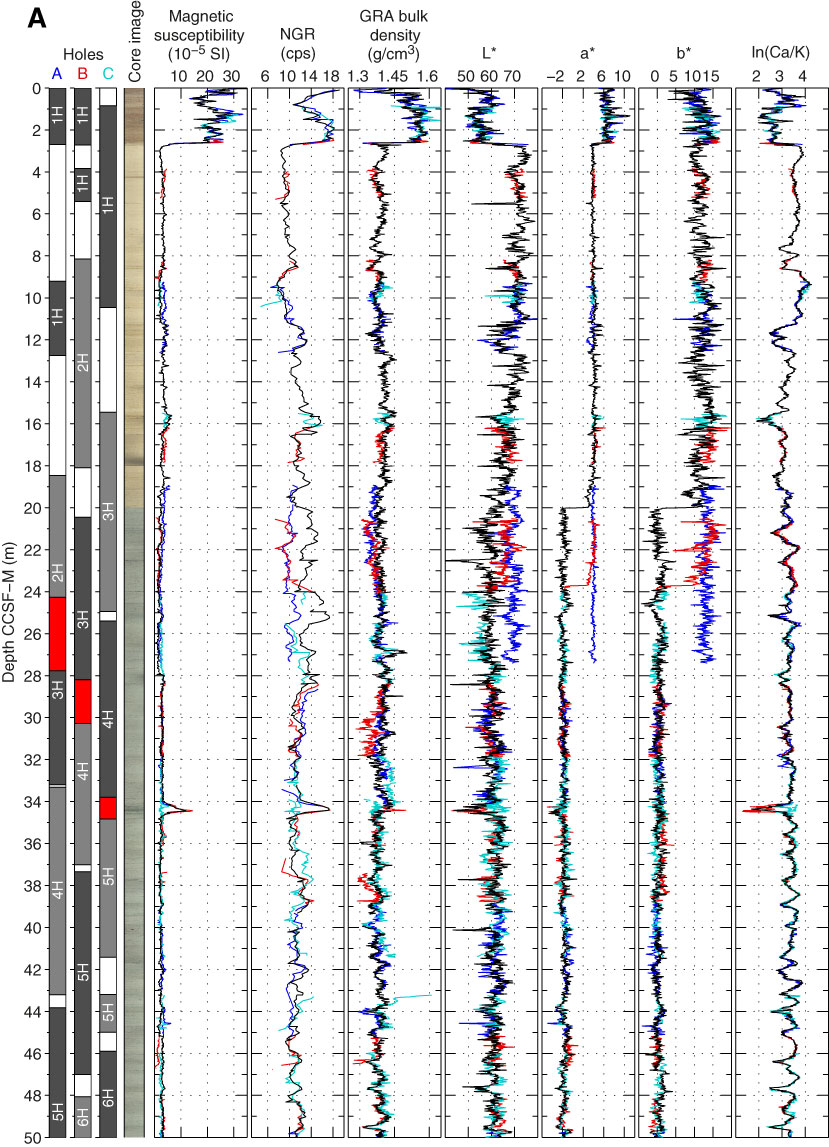
Figure F4. Spliced core image, physical properties, and XRF data in 50 m intervals, Site U1406. XRF data presented as natural logarithm of Ca and K ratios (ln[Ca/K]). Cores: two shades of gray = alternating cores, white = core gaps, red = intervals that overlap between successive cores. Data: dark blue = Hole U1406A, red = Hole U1406B, light blue = Hole U1406C, black = spliced record. Discontinuous intervals of the splice record are due to disturbances and core gaps. A. 0–50 m CCSF-M. (Continued on next six pages.)
Previous | Close | Next | Top of page