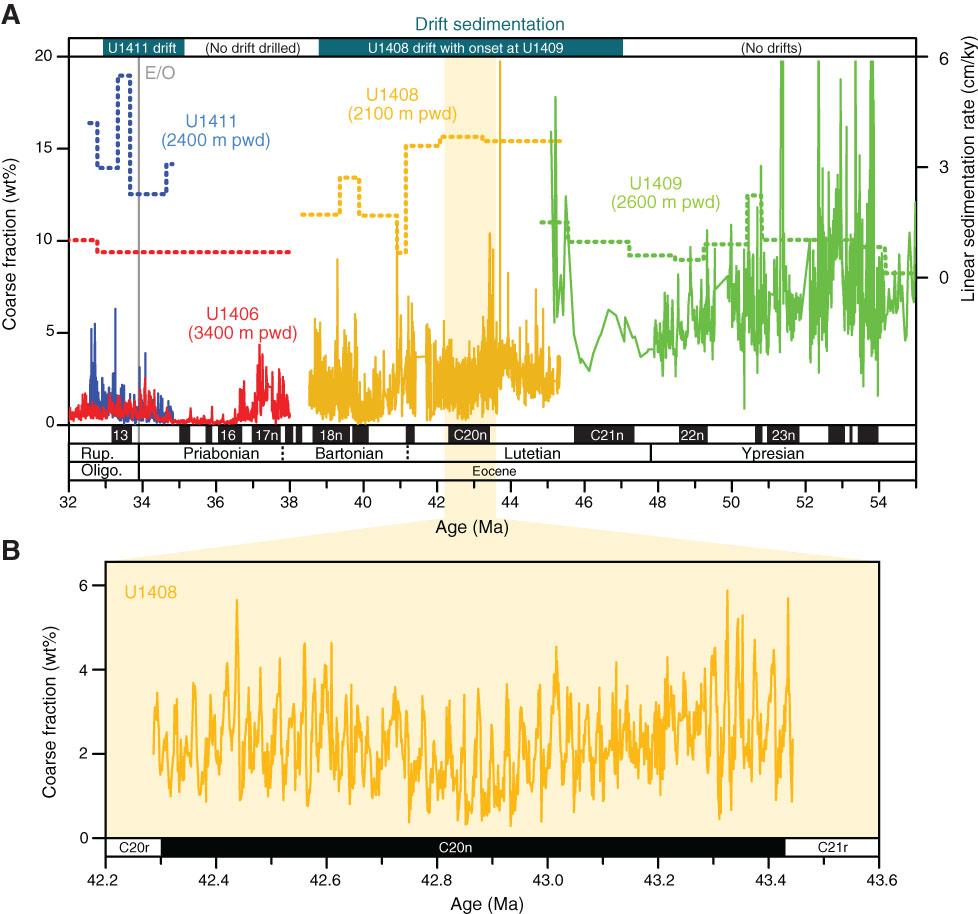
Figure F1. A. Weight percent CF along the Eocene megasplice at Expedition 342 sites (solid lines) overlain with linear sedimentation rates (dotted lines) estimated from shipboard age models. Although the records of wt% CF look noisy at the scale of the Eocene, a zoomed in interval (B) at Site U1408 from 42.2 to 43.6 Ma shows variability in wt% CF to be coherent variation in the record, not noise. Intervals with drift sedimentation are indicated in dark blue-green at the top of A. pwd = paleowater depth.
Close | Next | Top of page