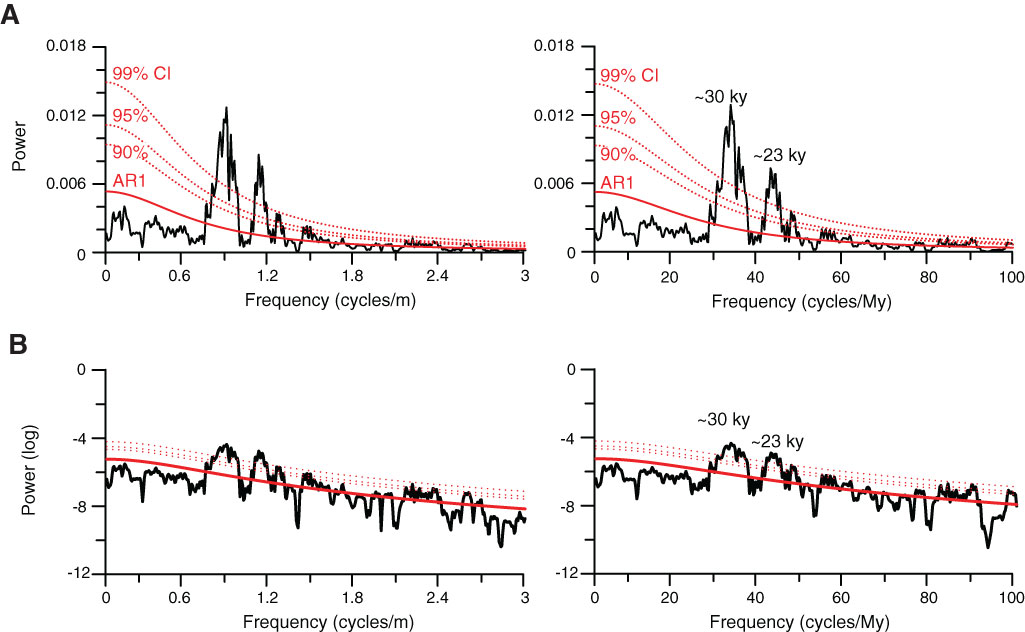
Figure F4. Spectral analysis of wt% CF in the depth (left) and age (right) domain (A. Linear power scale. B. Log power scale) in Magnetochron C20n at Site U1408 show significant power near orbital frequencies. This interval is not long enough to properly test for 400 ky eccentricity forcing.
Previous | Close | Top of page