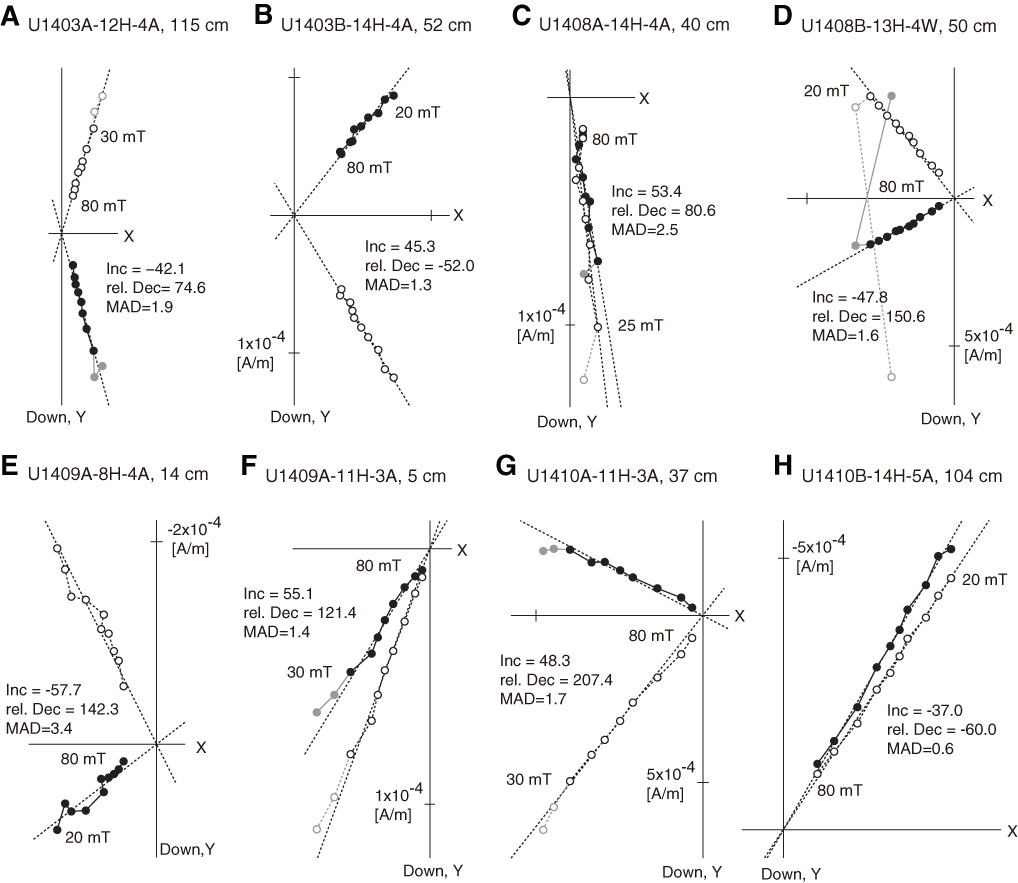
Figure F2. Representative orthogonal vector plots of AF demagnetization results from the U-channel samples. ChRM directions for (A, B) Site U1403, (C, D) Site U1408, (E, F) Site U1409, and (G, H) Site U1410. Solid circles = horizontal projections, open circles = vertical projections, shaded circles = data not used in PCA analyses, black dashed lines = best fit to the data. Inc = inclination (°), rel. Dec = relative declination (°), MAD = maximum angle of deviation (°).
Previous | Close | Next | Top of page