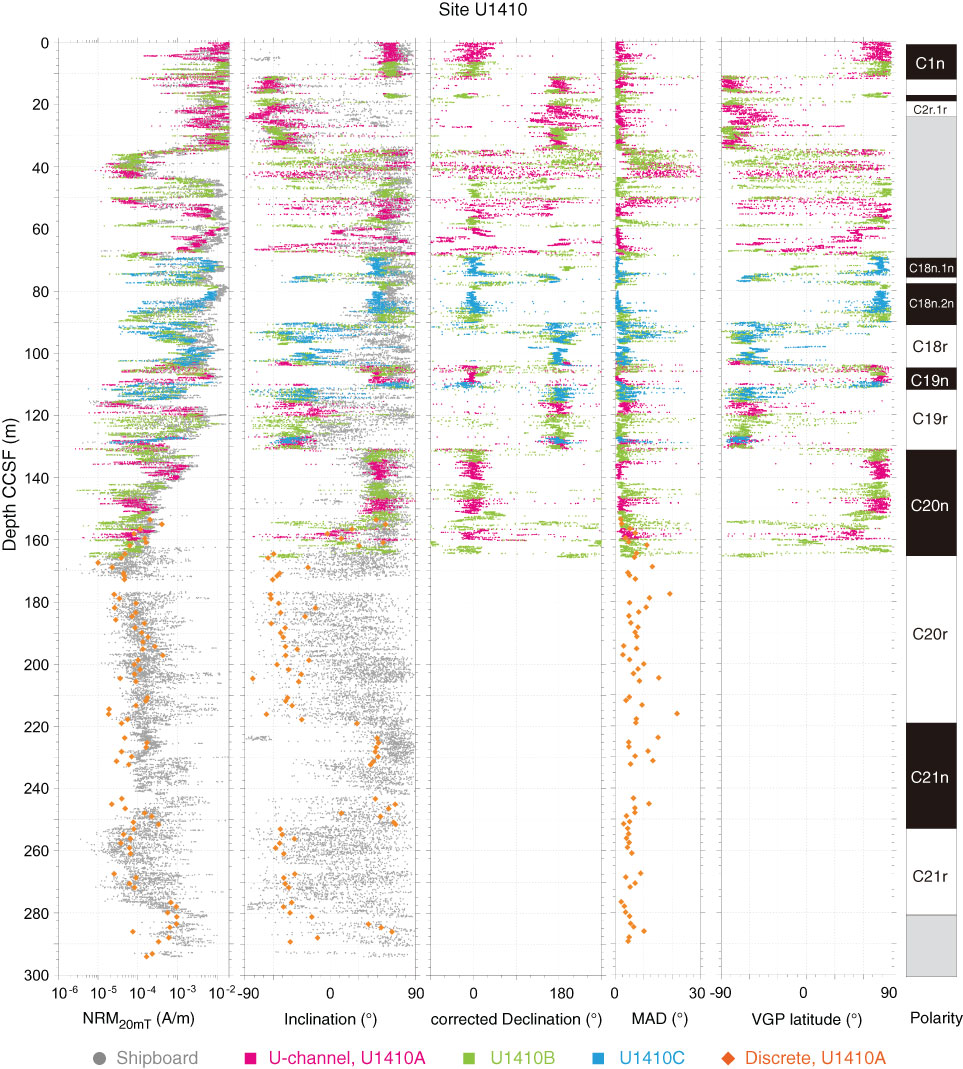
Figure F8. Plots of downhole variation of NRM intensity after 20 mT demagnetization, PCA inclination, corrected PCA declination, maximum angular deviation (MAD) and virtual geomagnetic pole (VGP) latitude for Site U1410. Pink = Hole U1410A; green = Hole U1410B; blue = Hole U1410C. Shaded = shipboard data. Interpreted paleomagnetic polarities and chrons are indicated in the rightmost panel (black = normal, white = reversed, shaded = unidentified).
Previous | Close | Top of page