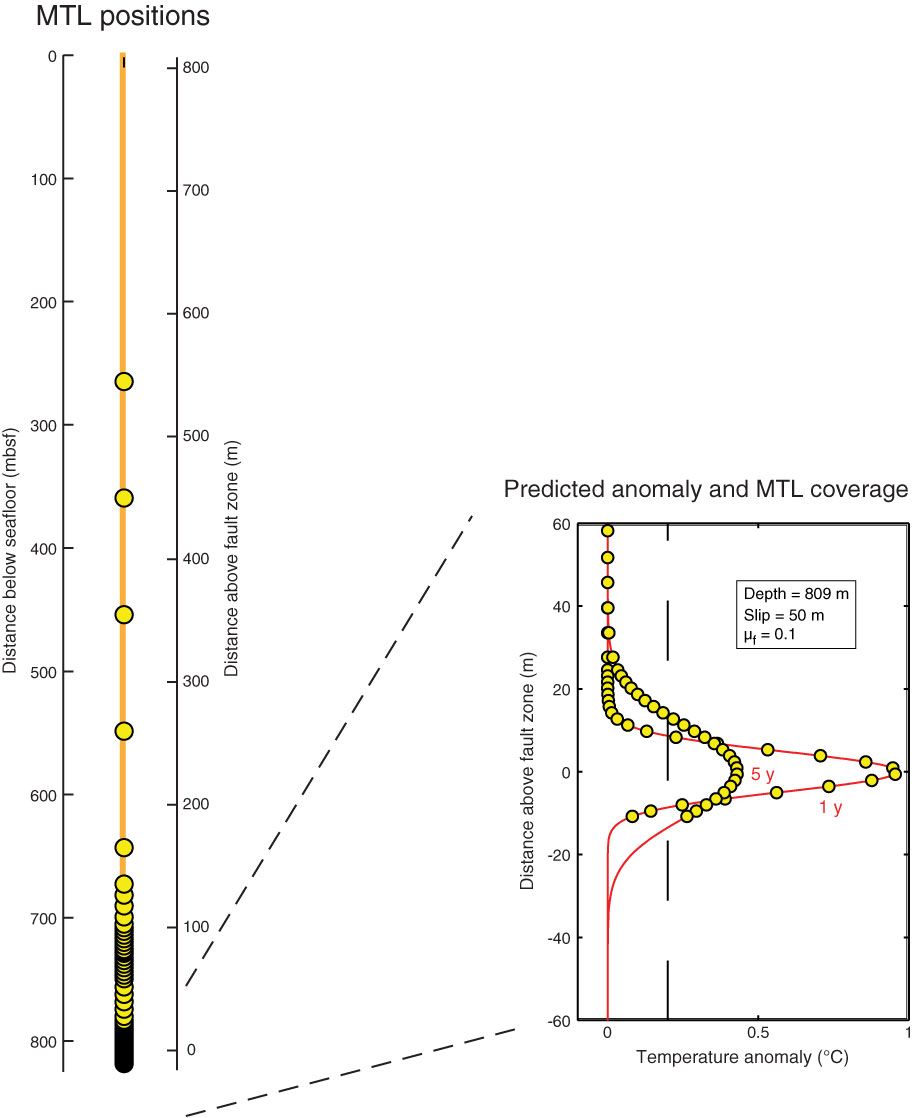
Figure F8. Plot of temperature sensor distribution for the miniature temperature logger (MTL) autonomous observatory deployed in Hole C0019D during Expedition 343T. The density of sensors increases near the 720 and 820 faults in order to accurately define the transient temperature anomaly produced by heating from the Tohoku-oki earthquake. The dense spacing is necessary to resolve the temperature anomaly, which is illustrated for a model temperature distribution in the vicinity of the 820 fault at 1 and 5 y after the earthquake.
Previous | Close | Next | Top of page