Previous | Close | Next
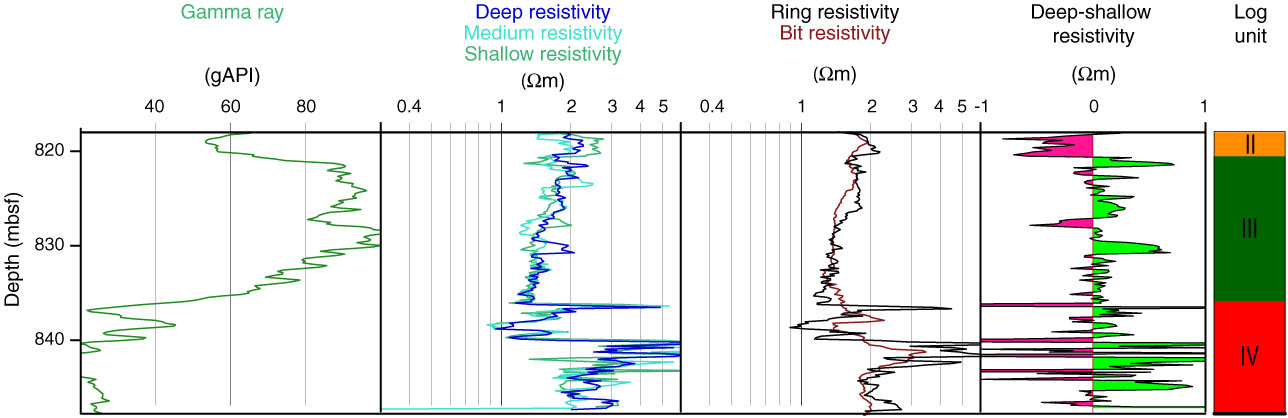
Figure F11. Plot of gamma ray, five resistivity logs, and the difference between deep and shallow resistivity illustrating variation in log response between log Units III and IV, Hole C0019B.
Previous | Close | Next | Top of page